
A Validated Visual Analytics Prototype for Monitoring and Alerting of Gantry 2 and OPTIS 2 Parameters at PSI CPT
A traceable, read-only monitoring prototype turns more than a decade of operational data from two proton-therapy systems into views of validated data for expert review.
Initial situation
The Paul Scherrer Institute (PSI) operates several proton-therapy treatment systems at its Center for Proton Therapy (CPT). Gantry 2 is a rotating treatment room used for deep-seated tumours, while OPTIS 2 uses a fixed horizontal beam line for ocular tumours. Both systems produce technical measurements, warnings, safety-interlock records and other operational data that can support routine review and investigation.
These records are distributed across historical exports that changed over time. File names, layouts, columns and other details are not always consistent, so long-term review cannot rely on simply combining every file. The preceding P5 project established the first traceable data pipeline and interactive monitoring dashboard for a limited period of Gantry 2 data. This P6 project builds on that prototype by extending the historical coverage, incorporating OPTIS 2 and strengthening validation, traceability and expert-review workflows.
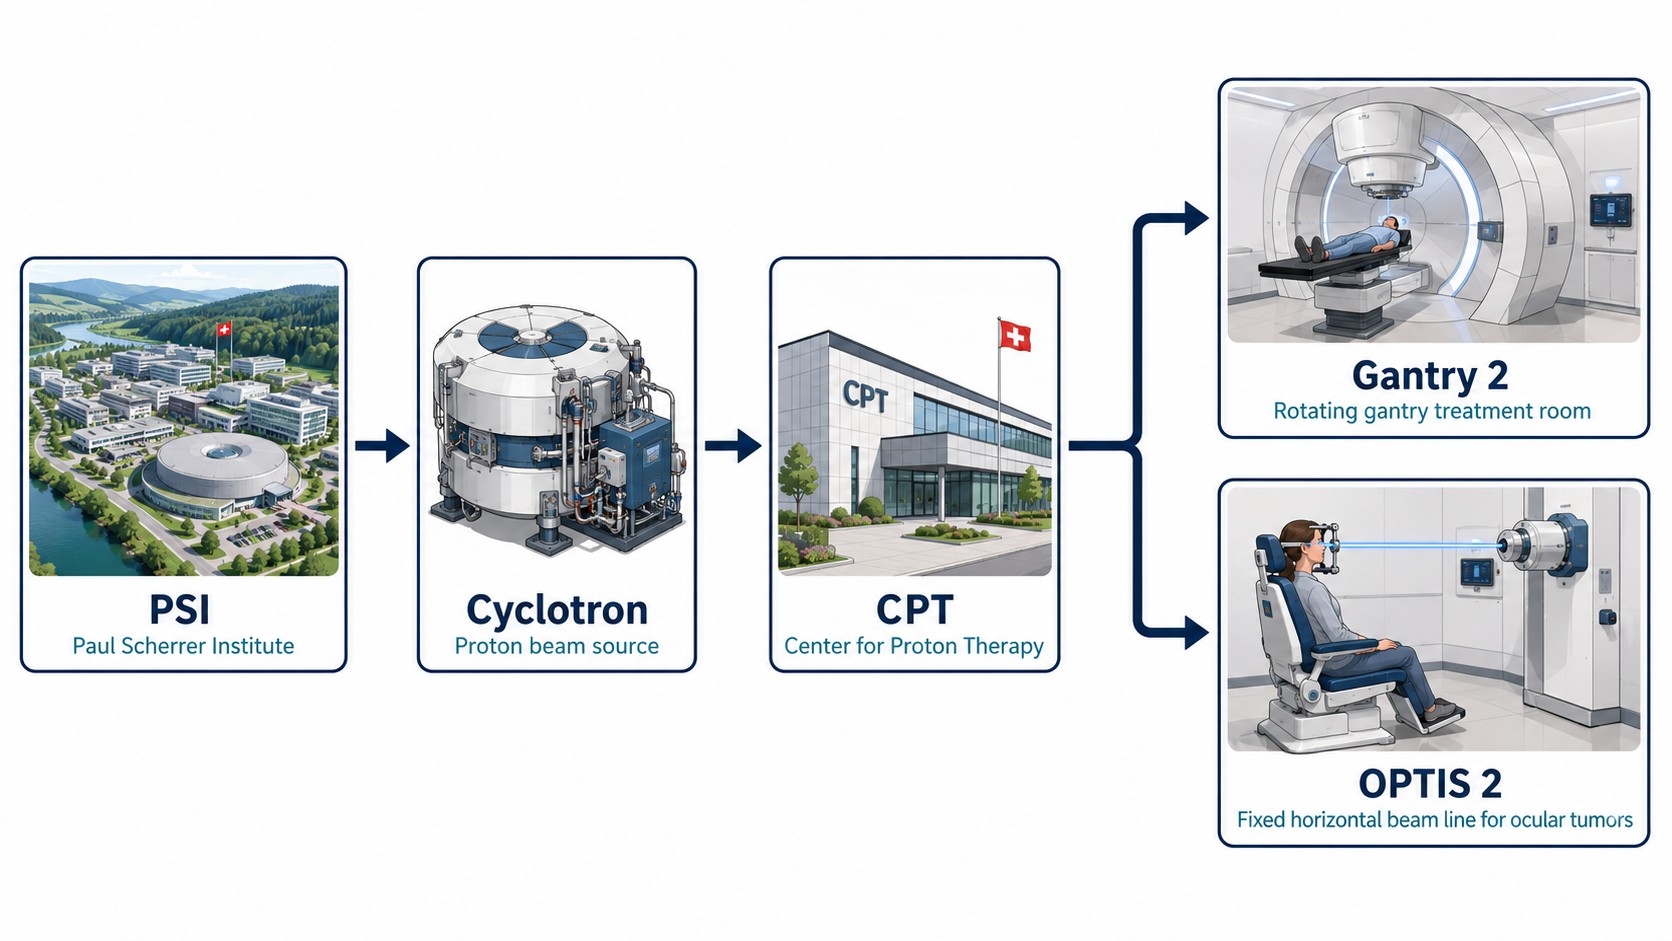
Simplified subject context: PSI's proton beam is used at the Center for Proton Therapy, including Gantry 2 and OPTIS 2.
Problem statement / Project goal
The goal was to extend the P5 prototype into a traceable monitoring and visual-analytics system for the reviewed historical data from both treatment systems. The system needed to process known historical formats reproducibly, check new outputs before they are published, preserve the context needed to interpret them, and present the results through dashboard views organised around recurring monitoring tasks.
The prototype was deliberately designed as a read-only aid for expert review. It does not write to treatment or control systems. Statistical methods may highlight unusual observations, but they do not create a validated clinical or operational alarm.
Monitoring overview
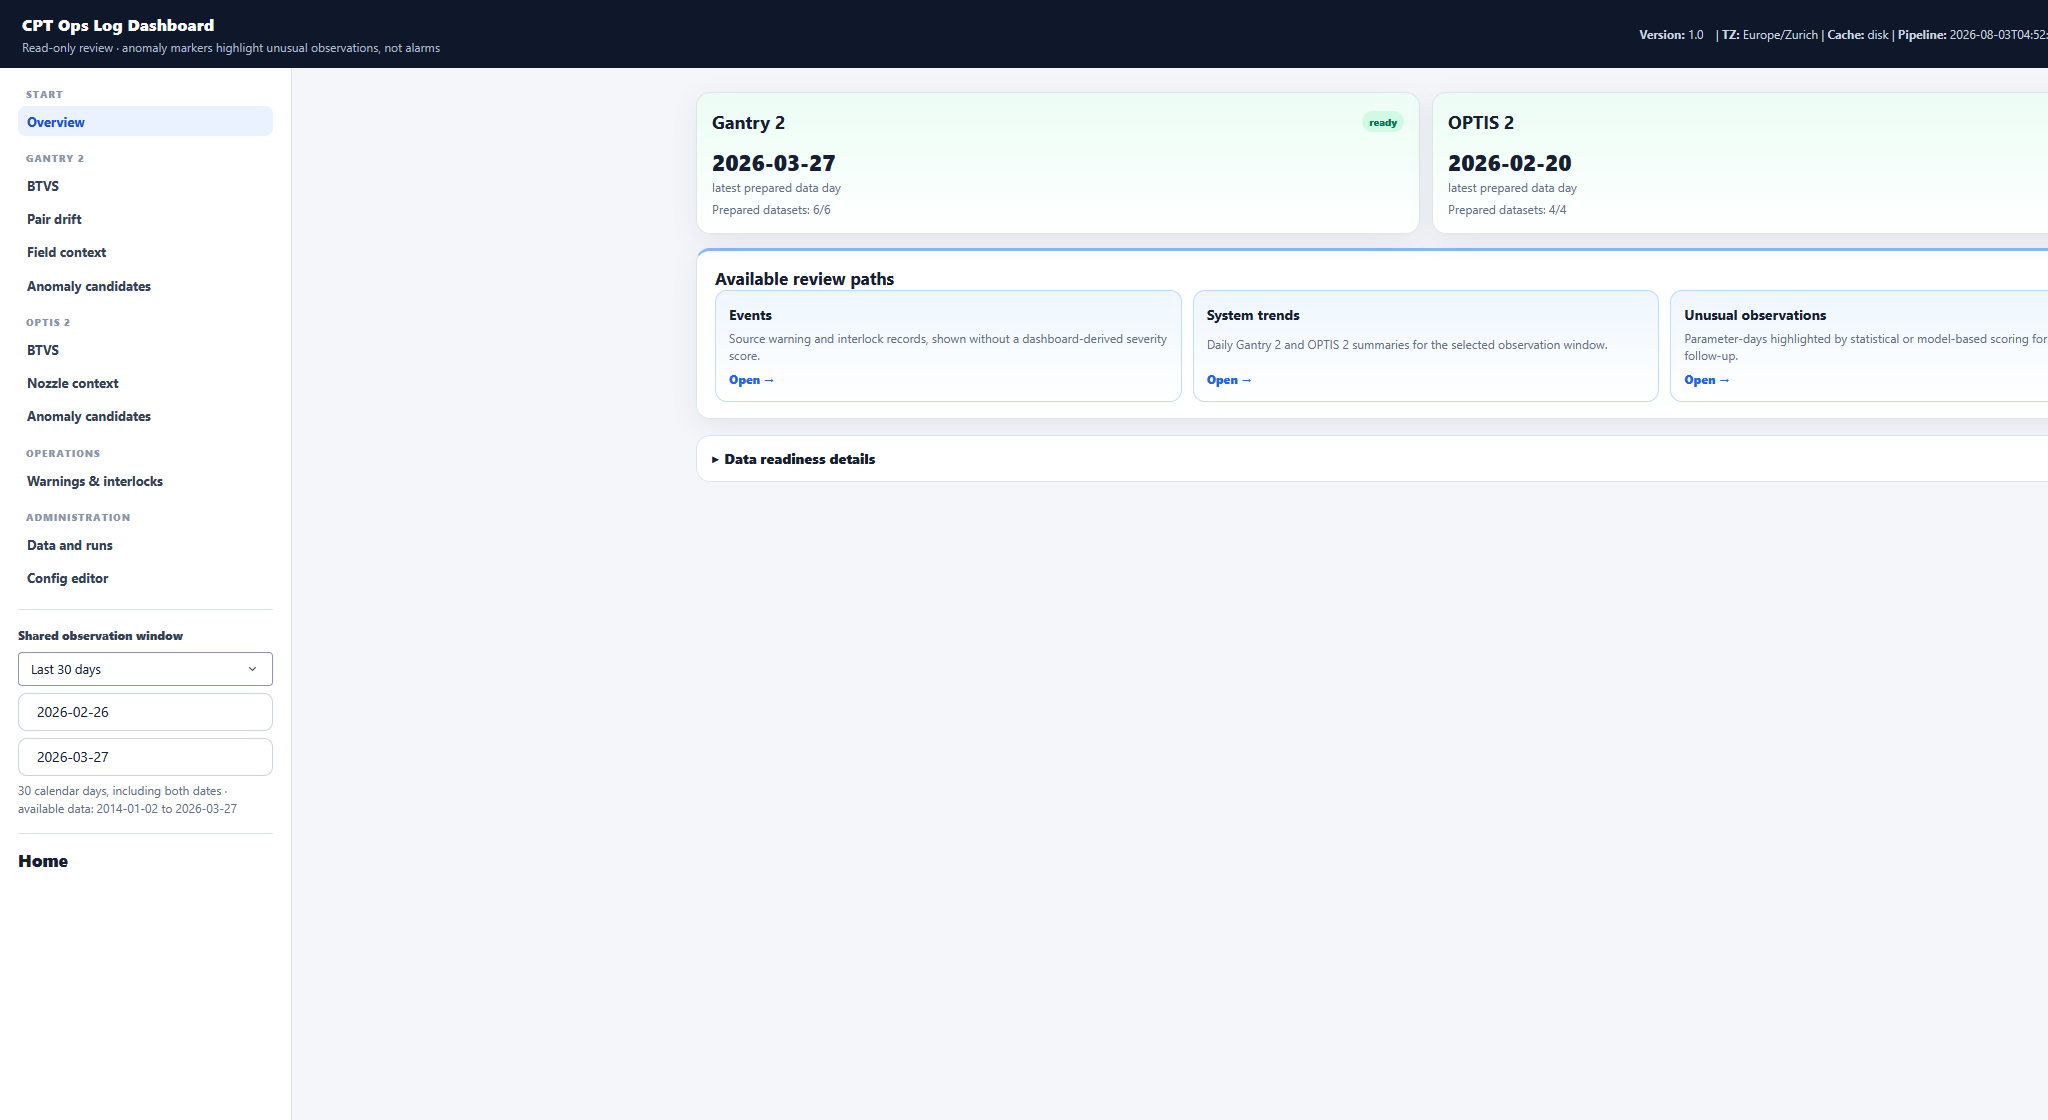
The starting page shows which prepared data are available and directs reviewers to trends, recorded events and unusual observations.
Trend review
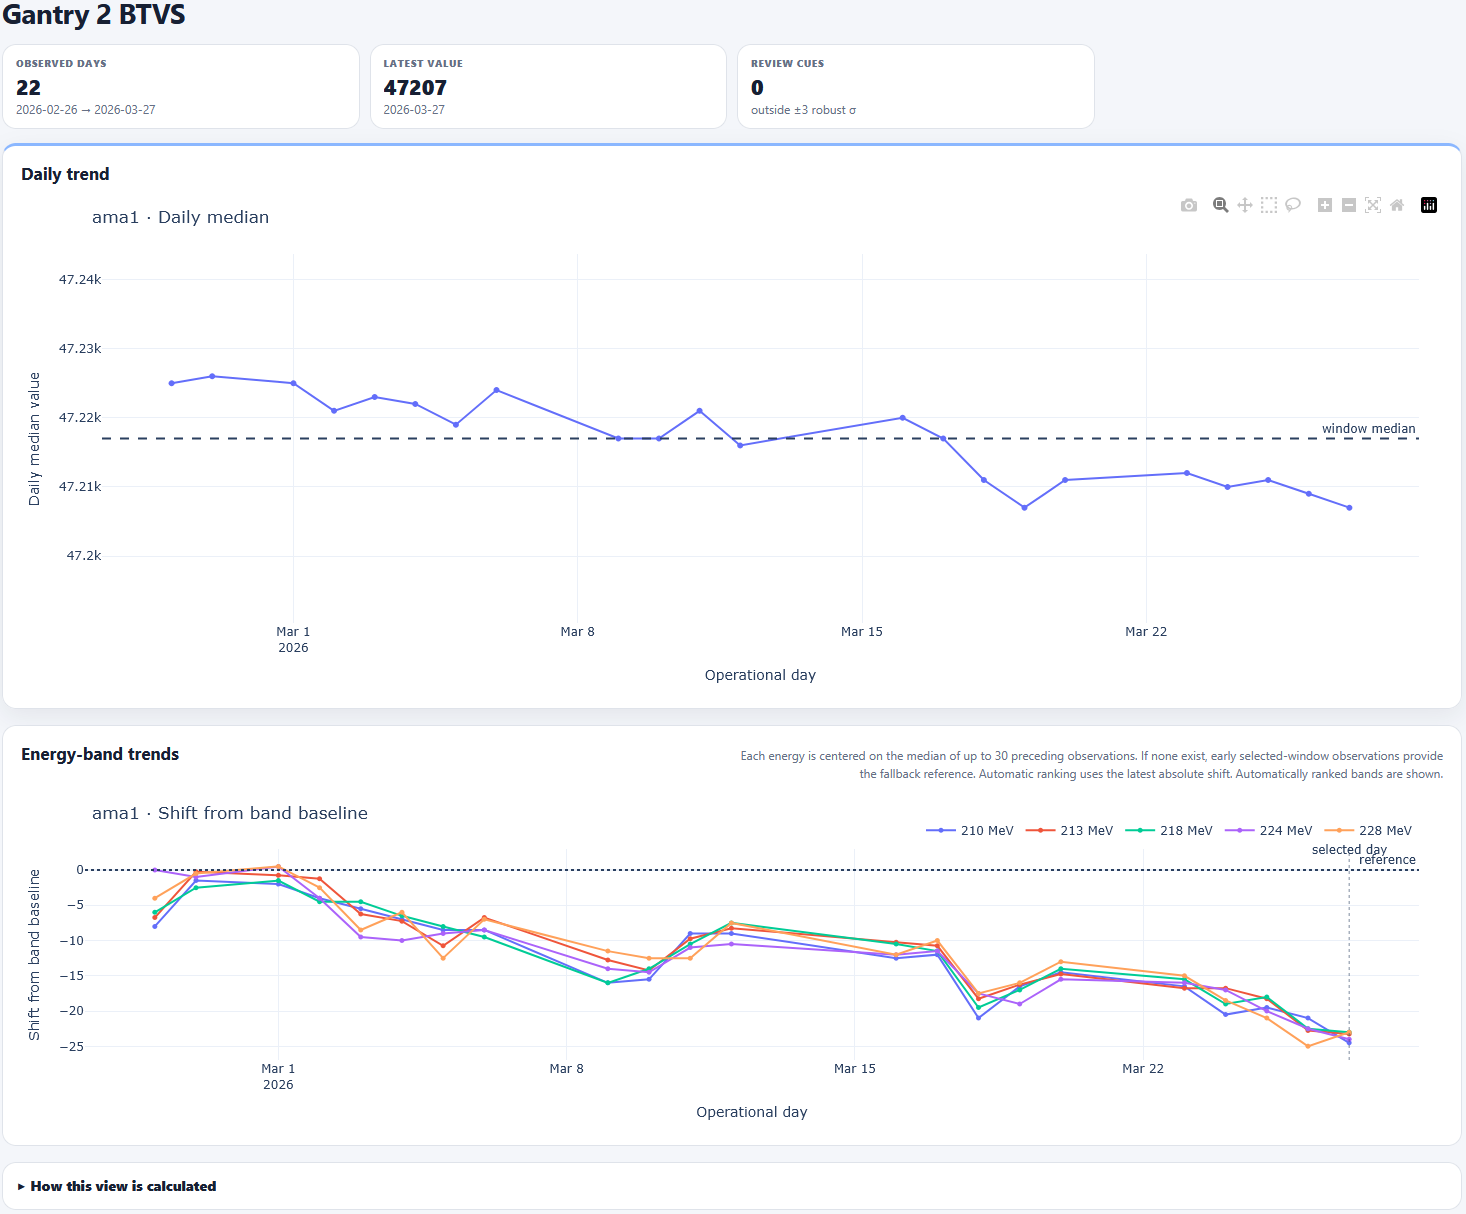
Long-term trends can be reviewed together with operating context such as beam energy, helping experts compare like with like.
Recorded events
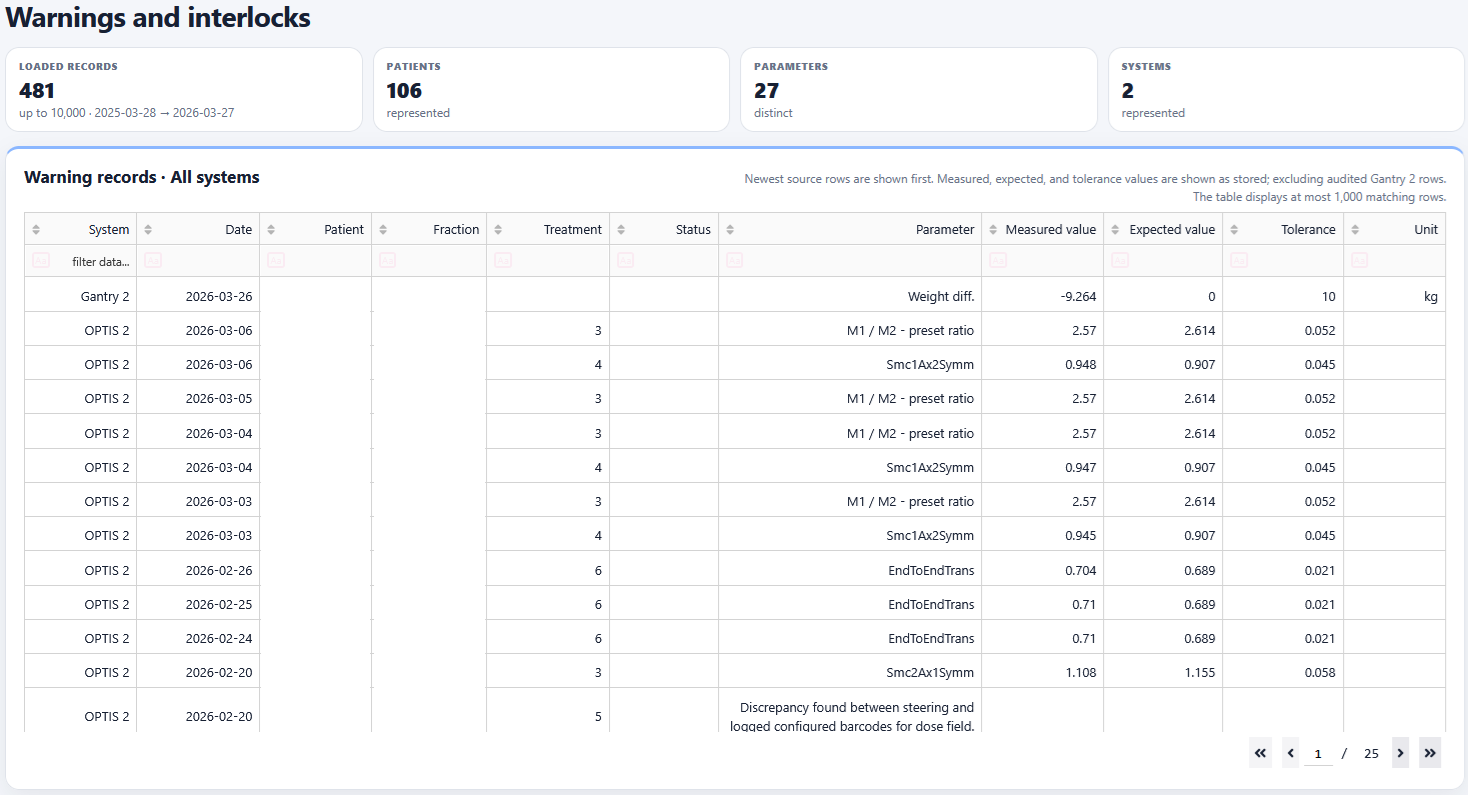
Warnings and safety interlocks remain identifiable as source-system records and can be filtered for focused follow-up.
Solution developed and its benefits
The data pipeline works as a controlled sequence. It recognises supported source files, records how they were interpreted, standardises the known historical formats, prepares the data needed by the dashboard, validates new products, and only then makes them available for review. If the relevant inputs and processing rules have not changed, previously validated products can be reused.
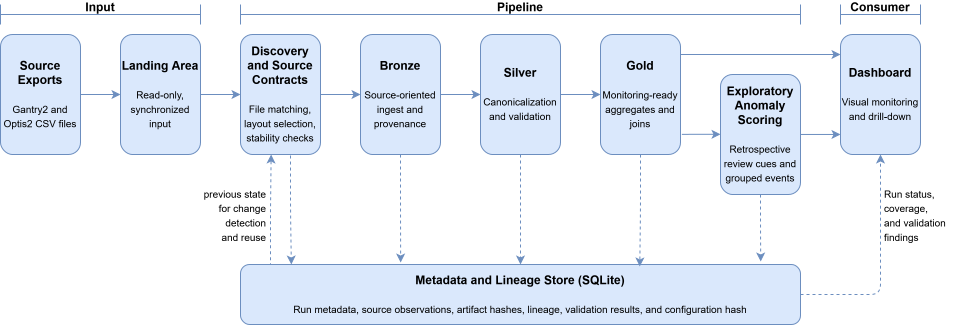
The architecture separates source handling, data preparation, exploratory anomaly analysis and presentation while recording how each published result was produced.
- Historical Gantry 2 and selected OPTIS 2 data are brought into one monitoring structure while retaining their different operating contexts.
- Unsupported file structures are rejected for review instead of being silently guessed.
- New monitoring products are checked before publication.
- Displayed results remain traceable to their source files, processing state and validation decisions.
- The dashboard supports overview-to-detail review of trends, operating context, warnings, interlocks and unusual observations.
- Unchanged validated products can be reused instead of rebuilding everything on every run.
Results
The retained final data state contained all ten prepared dashboard products. The available history reaches back to 2014 for Gantry 2 and 2015 for OPTIS 2, with the latest prepared data from March 2026. The fixed release was also tested in a Linux environment similar to the intended PSI server.
A formative evaluation earlier in the project involved all three identified prospective local users. Task ratings were generally positive and the mean System Usability Scale score was 86.7. Because that study evaluated dashboard version 0.3.0 rather than the final interface, it informed the redesign but does not establish the usability of the final release.
Unusual observations
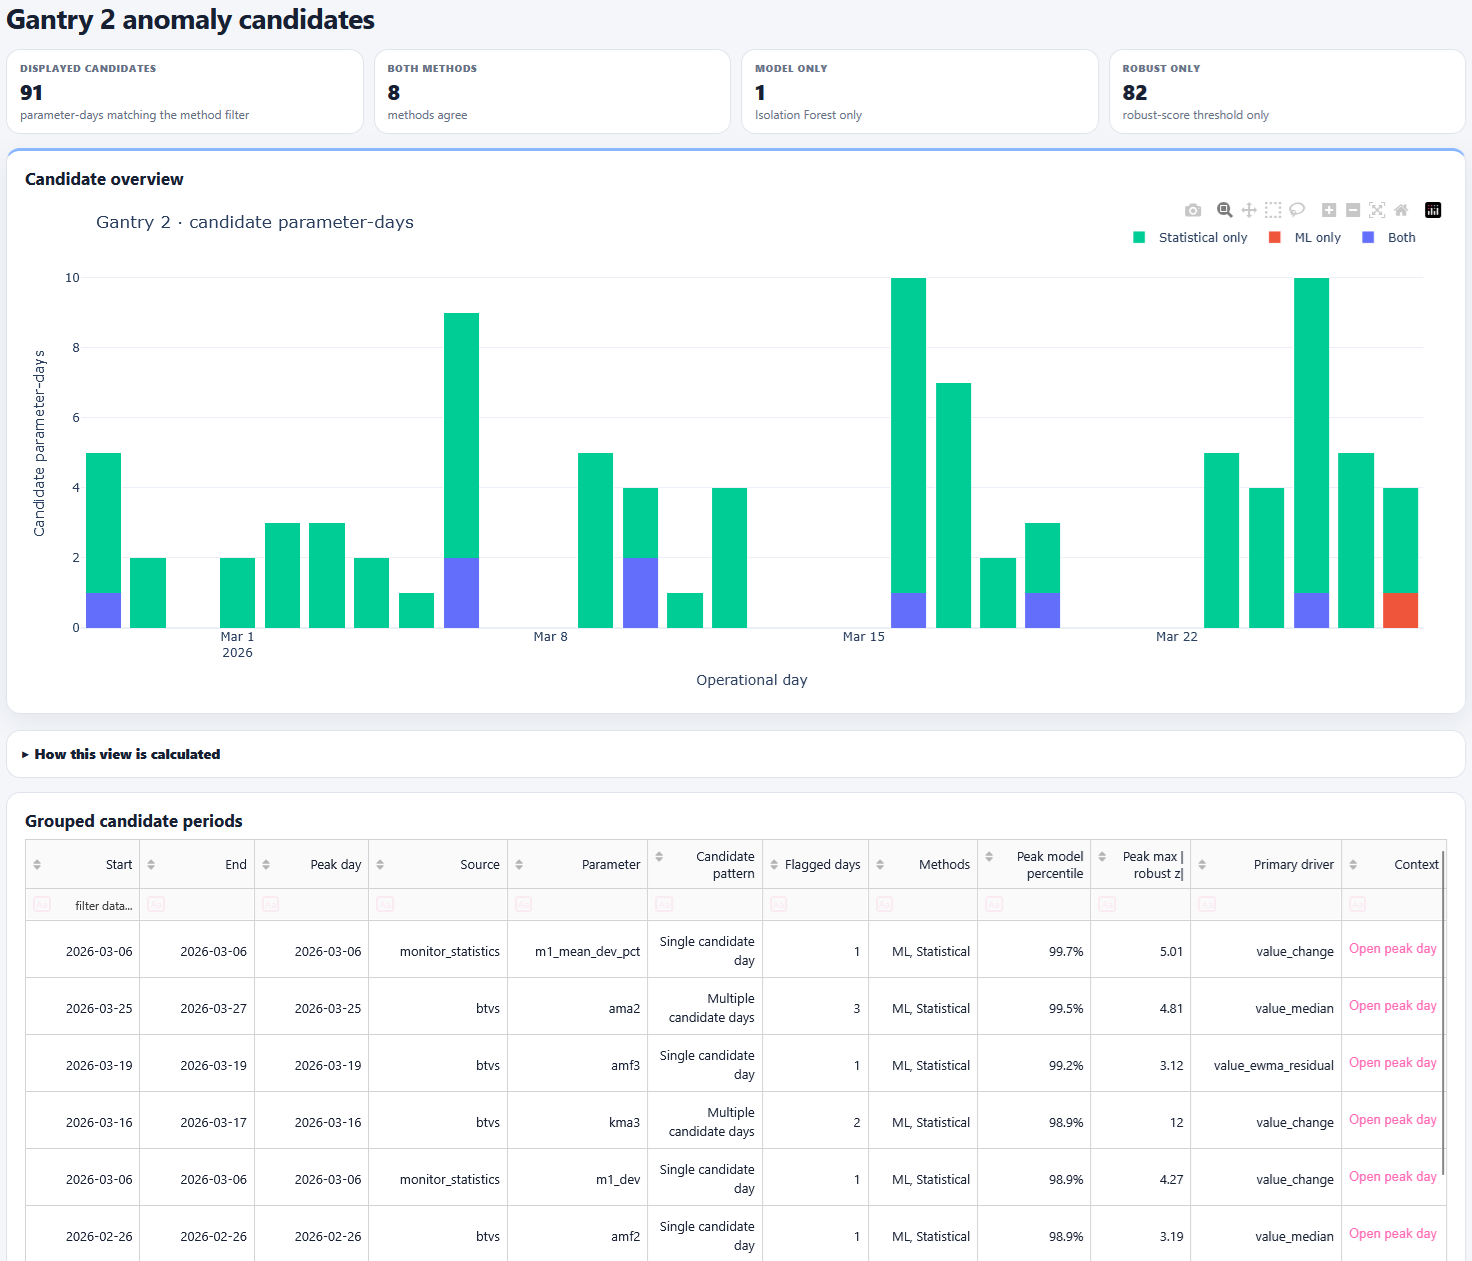
Statistically unusual daily observations are grouped into a review queue. A candidate is a prompt for inspection, not evidence of a fault.
Data quality and coverage
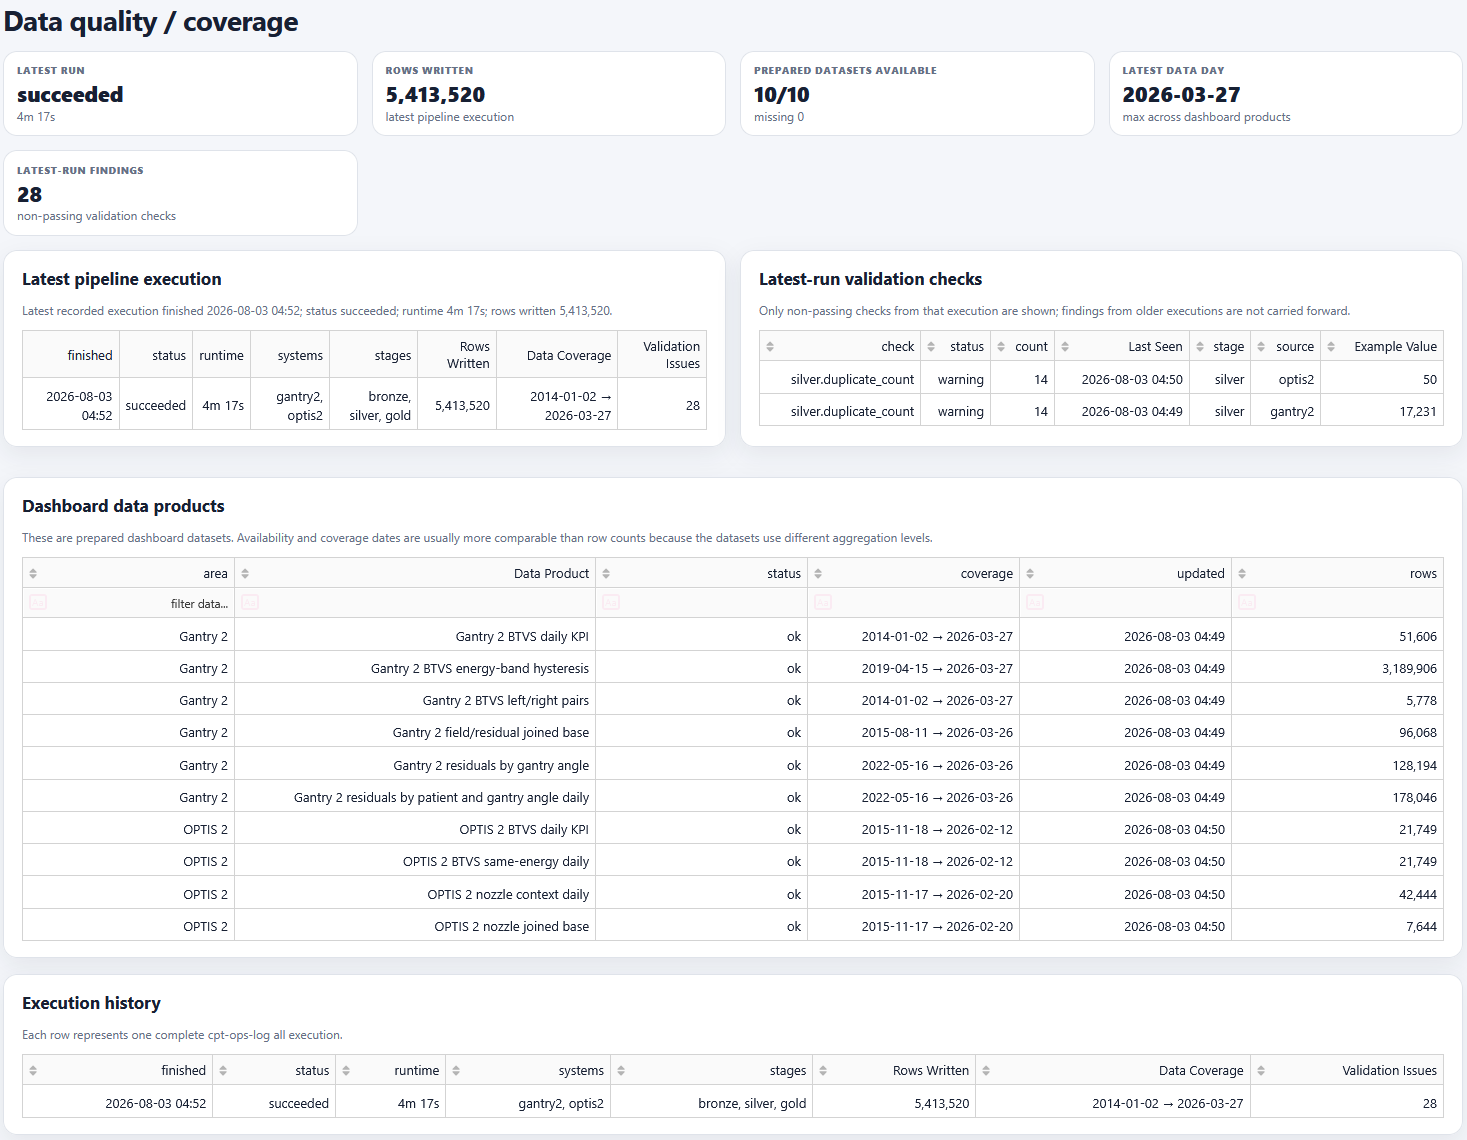
The dashboard exposes prepared products, data coverage and validation findings so that the processing state is visible rather than a black box.
Important scope: final deployment and operational acceptance on PSI infrastructure, a release-equivalent user evaluation, and domain validation of the anomaly candidates remained open at hand-in. The prototype supports investigation and prioritisation; it does not replace formal quality-assurance procedures or clinical judgement.
Further information: Bachelor thesis report (PDF)
Key terms
- Gantry 2PSI treatment station with a rotating gantry, used for deep-seated tumours.
- OPTIS 2PSI facility dedicated to ocular proton therapy using a fixed horizontal beam line.
- Data pipelineA repeatable sequence that reads, checks, transforms and prepares source files for analysis.
- Source contractVersioned rules describing how a known historical file format is recognised, interpreted and validated.
- Provenance / lineageRecorded information linking a published data product to its source files, processing steps, configuration and validation decisions.
- Bronze, Silver, GoldThree processing stages: source-oriented ingestion, standardisation, and preparation of monitoring-ready data products.
- Anomaly candidateAn observation flagged as statistically unusual and placed in a review queue. It is not, by itself, evidence of a fault or an alarm.
- Isolation ForestAn unsupervised machine-learning method used here as one exploratory signal for unusual observations.
- TechnologiesPython, Dash and Plotly, with versioned configuration, automated tests and container-based deployment material.
Customer
Paul Scherrer Institute PSI
Center for Proton Therapy (CPT)
Villigen, Switzerland
Project contacts: Dr. Zema Chowdhuri and Santiago Perez Carmona
PSI Center for Proton Therapy
Team
Student
Christoph Elmiger
Academic supervisors
Prof. Dr. Arzu Çöltekin
Cédric Merz
Expert
Jonas Oesch