
Dashboard for Daily Measured and Evaluated Parameters from Gantry2
Interactive dashboard and traceable data pipeline for daily Gantry2 measurements at PSI CPT, enabling trend, drift, and context-aware visual analysis over time.
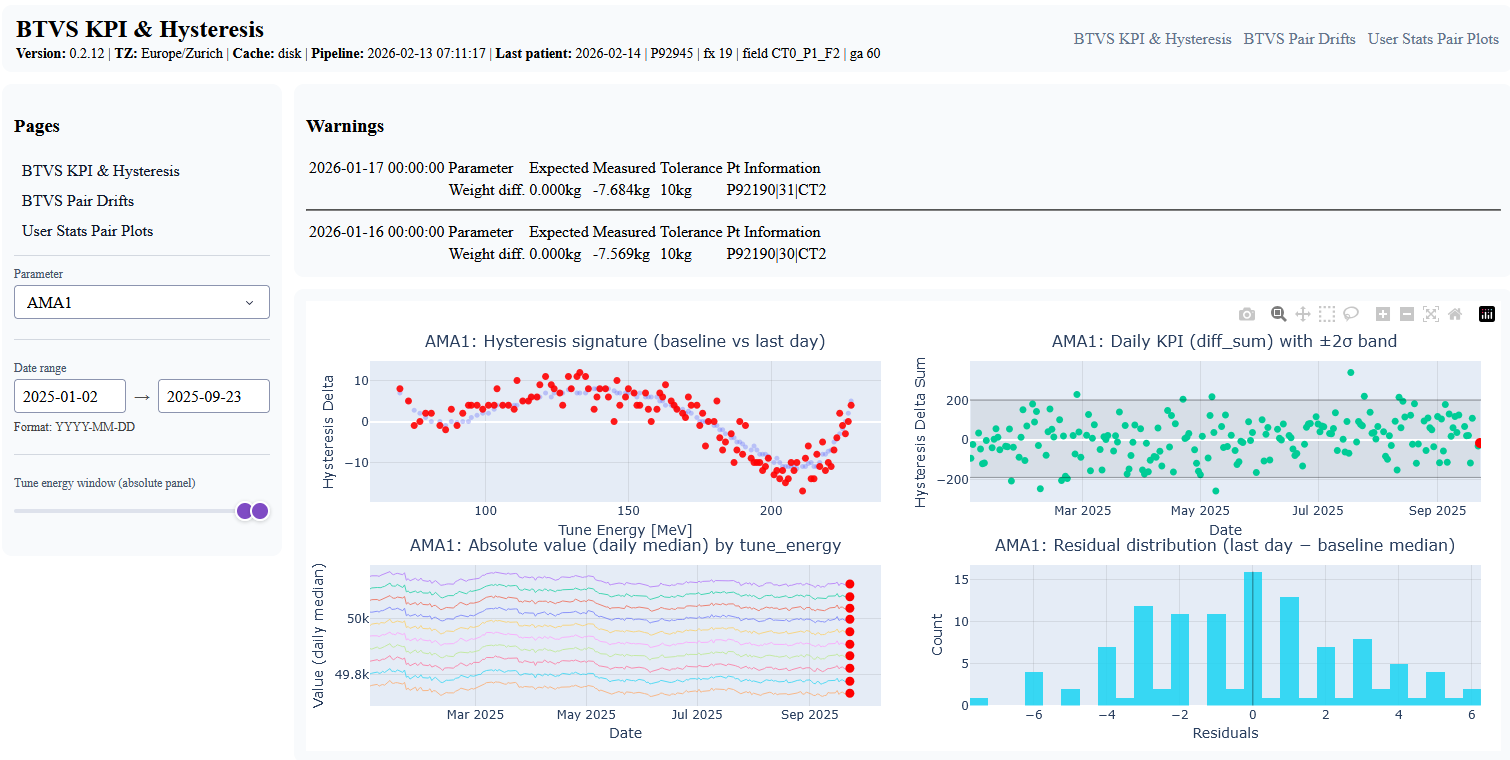
Dashboard prototype main page (overview).
Project Overview
This IP5 project implements an interactive dashboard prototype and a reproducible, traceable data pipeline for daily measured and evaluated parameters from Gantry2. The work was developed in collaboration with PSI CPT (Center for Proton Therapy).
The main objective is to support human-in-the-loop monitoring by making trends, drifts, and contextual warning signals easier to inspect than in previous CSV export and manual plotting workflows.
- Project typeIP5 student project (FHNW)
- Partner institutePSI CPT (Center for Proton Therapy, PSI)
- Main focusVisual analytics, traceable data pipeline, deployment & operations
- TechnologiesPython, Dash/Plotly, DuckDB, Parquet, pandas, Podman, systemd
Context and Problem Statement
Proton therapy operations depend on stable machine behavior and reliable quality-related measurements. At PSI CPT, daily Gantry2 measurements and derived parameters are available, but without integrated processing and visualization they are difficult to use for consistent long-term operational monitoring.
The project addresses this gap by combining a reproducible data pipeline with an interactive dashboard. The prototype replaces ad-hoc CSV-based plotting workflows with a more structured, repeatable, and traceable visual analytics workflow.
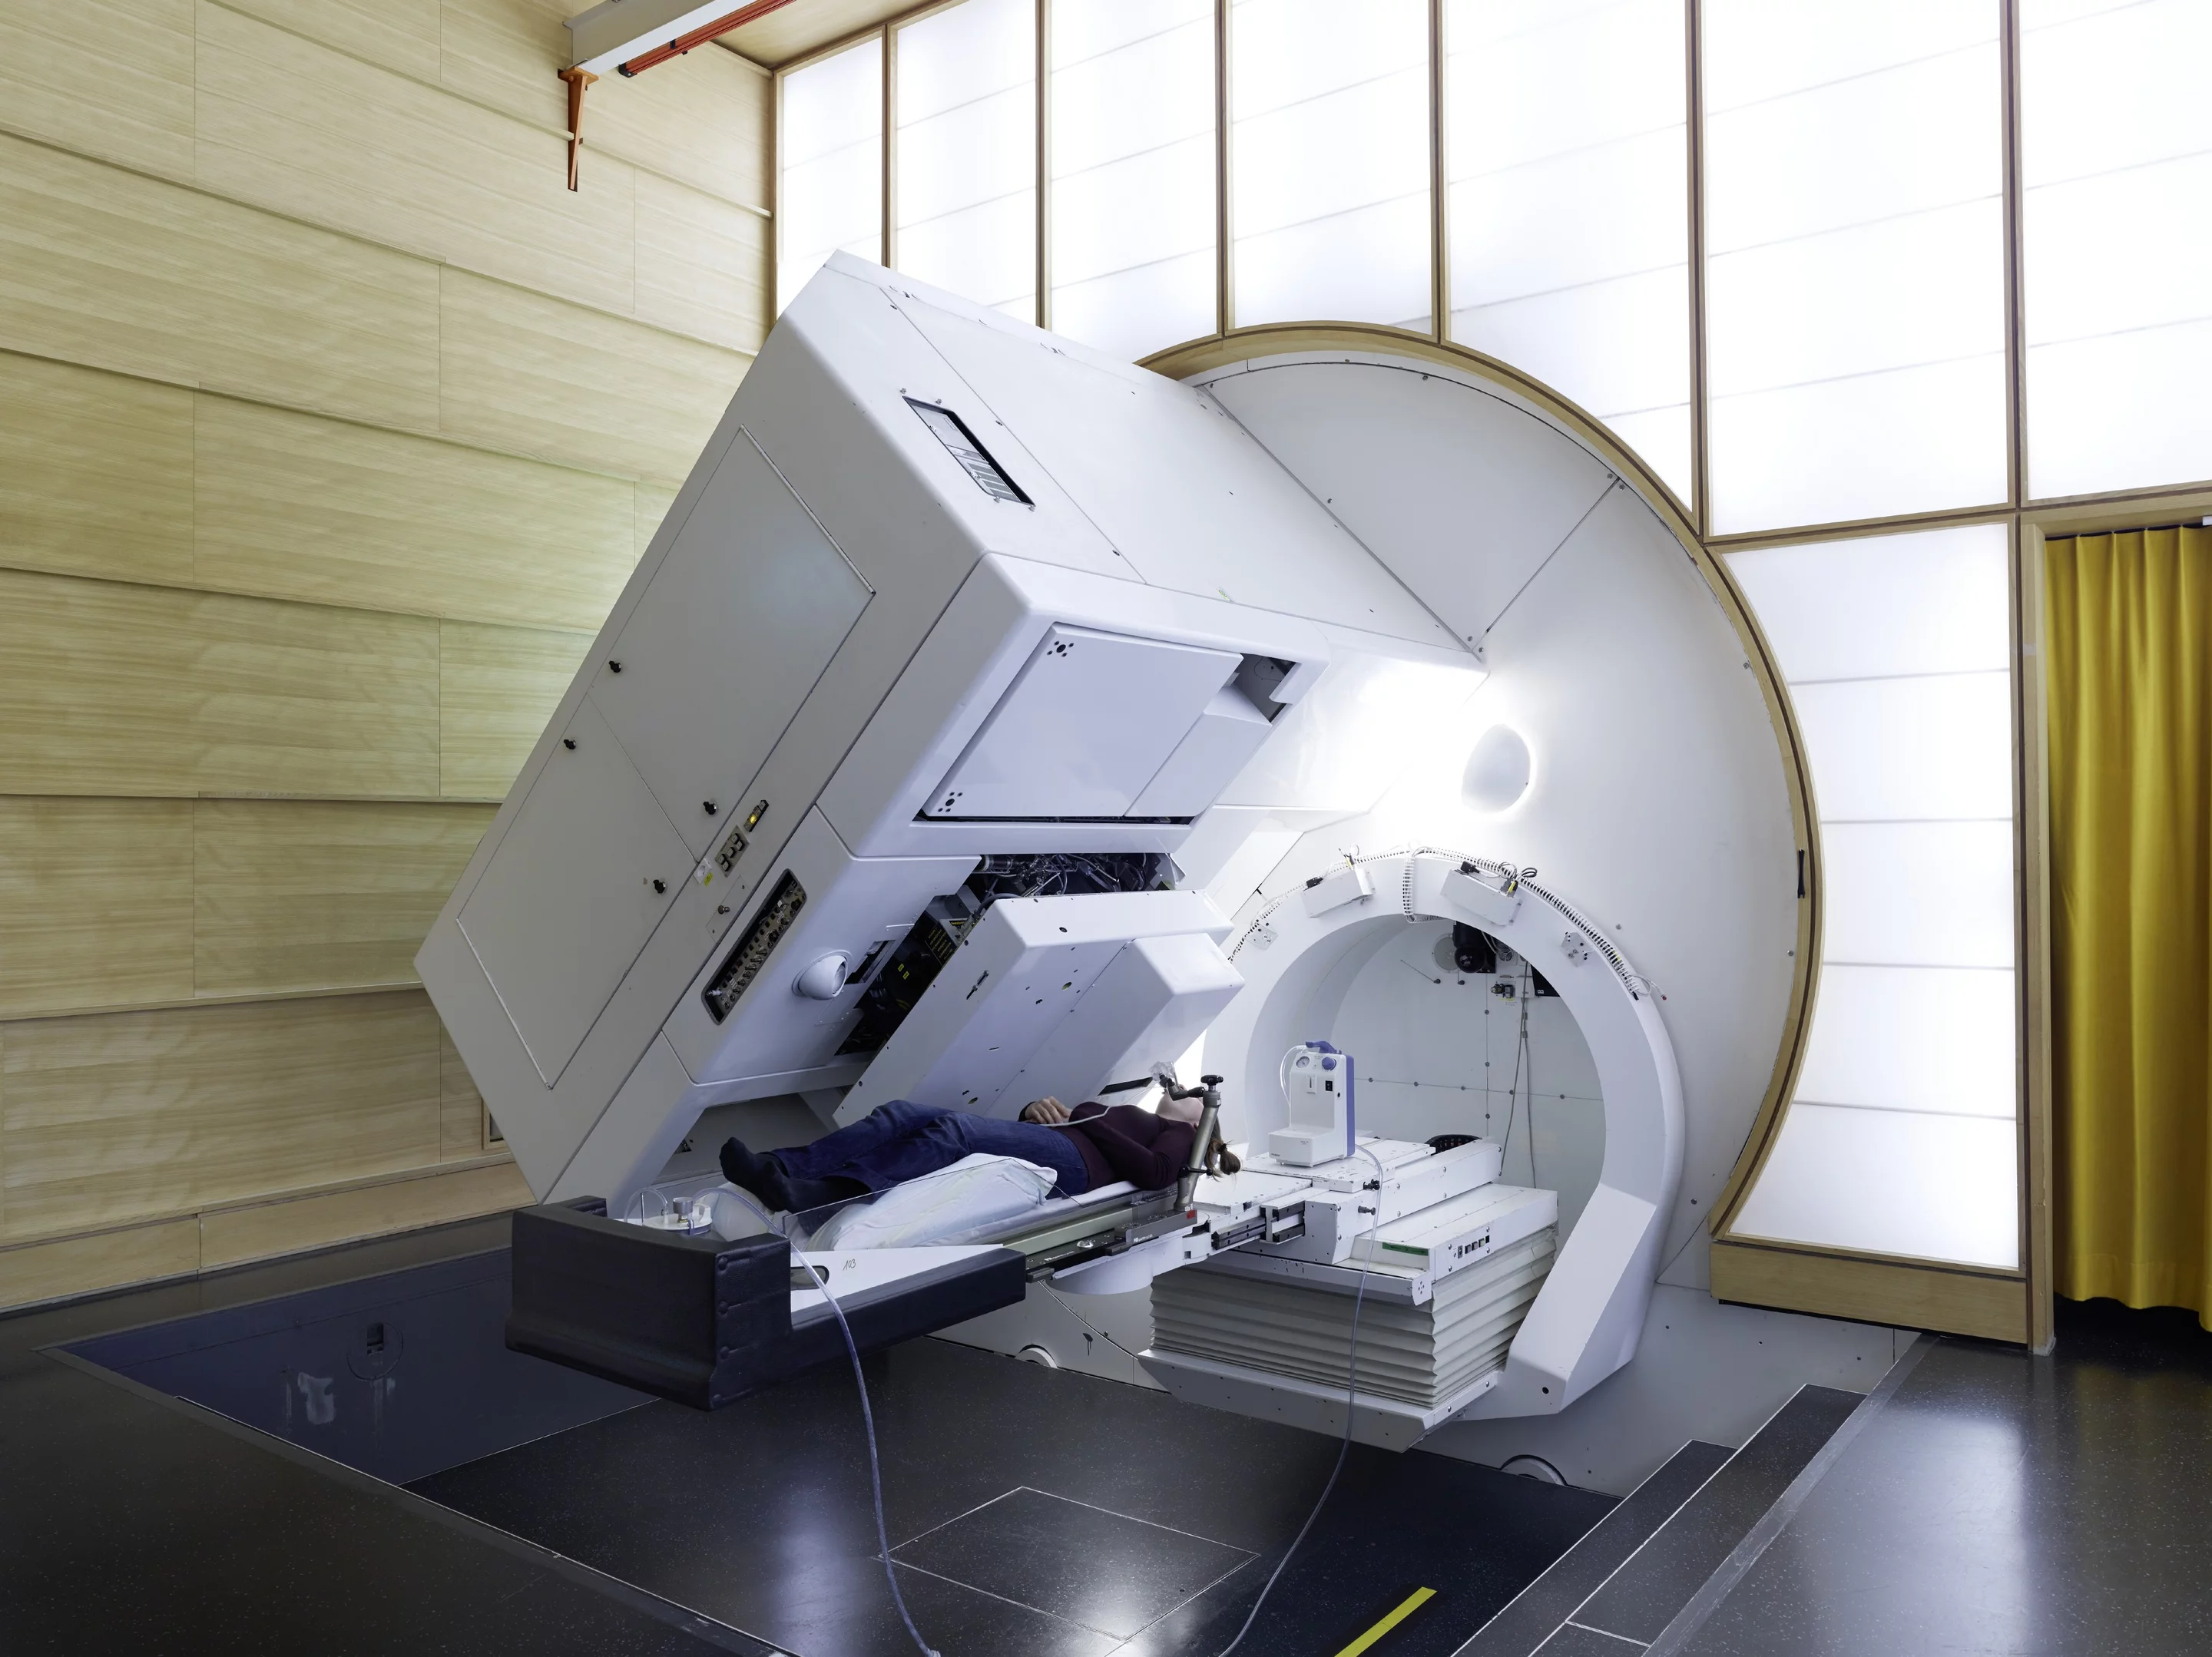
Gantry2 at PSI CPT.
Project Goals
Domain goals
- Make trends and drifts visible over time
- Support interpretable investigation of anomalies
- Include warnings/interlocks as contextual signals
- Support monitoring workflows (not a replacement for clinical QA processes)
Technical goals
- Implement a traceable, idempotent data pipeline
- Produce analysis-ready Parquet marts
- Provide a performant interactive web dashboard
- Enable future extension with additional analyses
Approach and Technical Design
The solution combines a data-oriented processing pipeline with an interactive frontend. Raw source files are ingested, validated, and transformed into curated analytical layers (marts). The dashboard then visualizes KPIs, hysteresis-related views, drift behavior, and pairwise relationships, enriched with warning/interlock context.
Pipeline and Dashboard Architecture (simplified)
Warnings / Interlocks
Input checks
Parquet tables
Filters + interactions
Trend / drift inspection
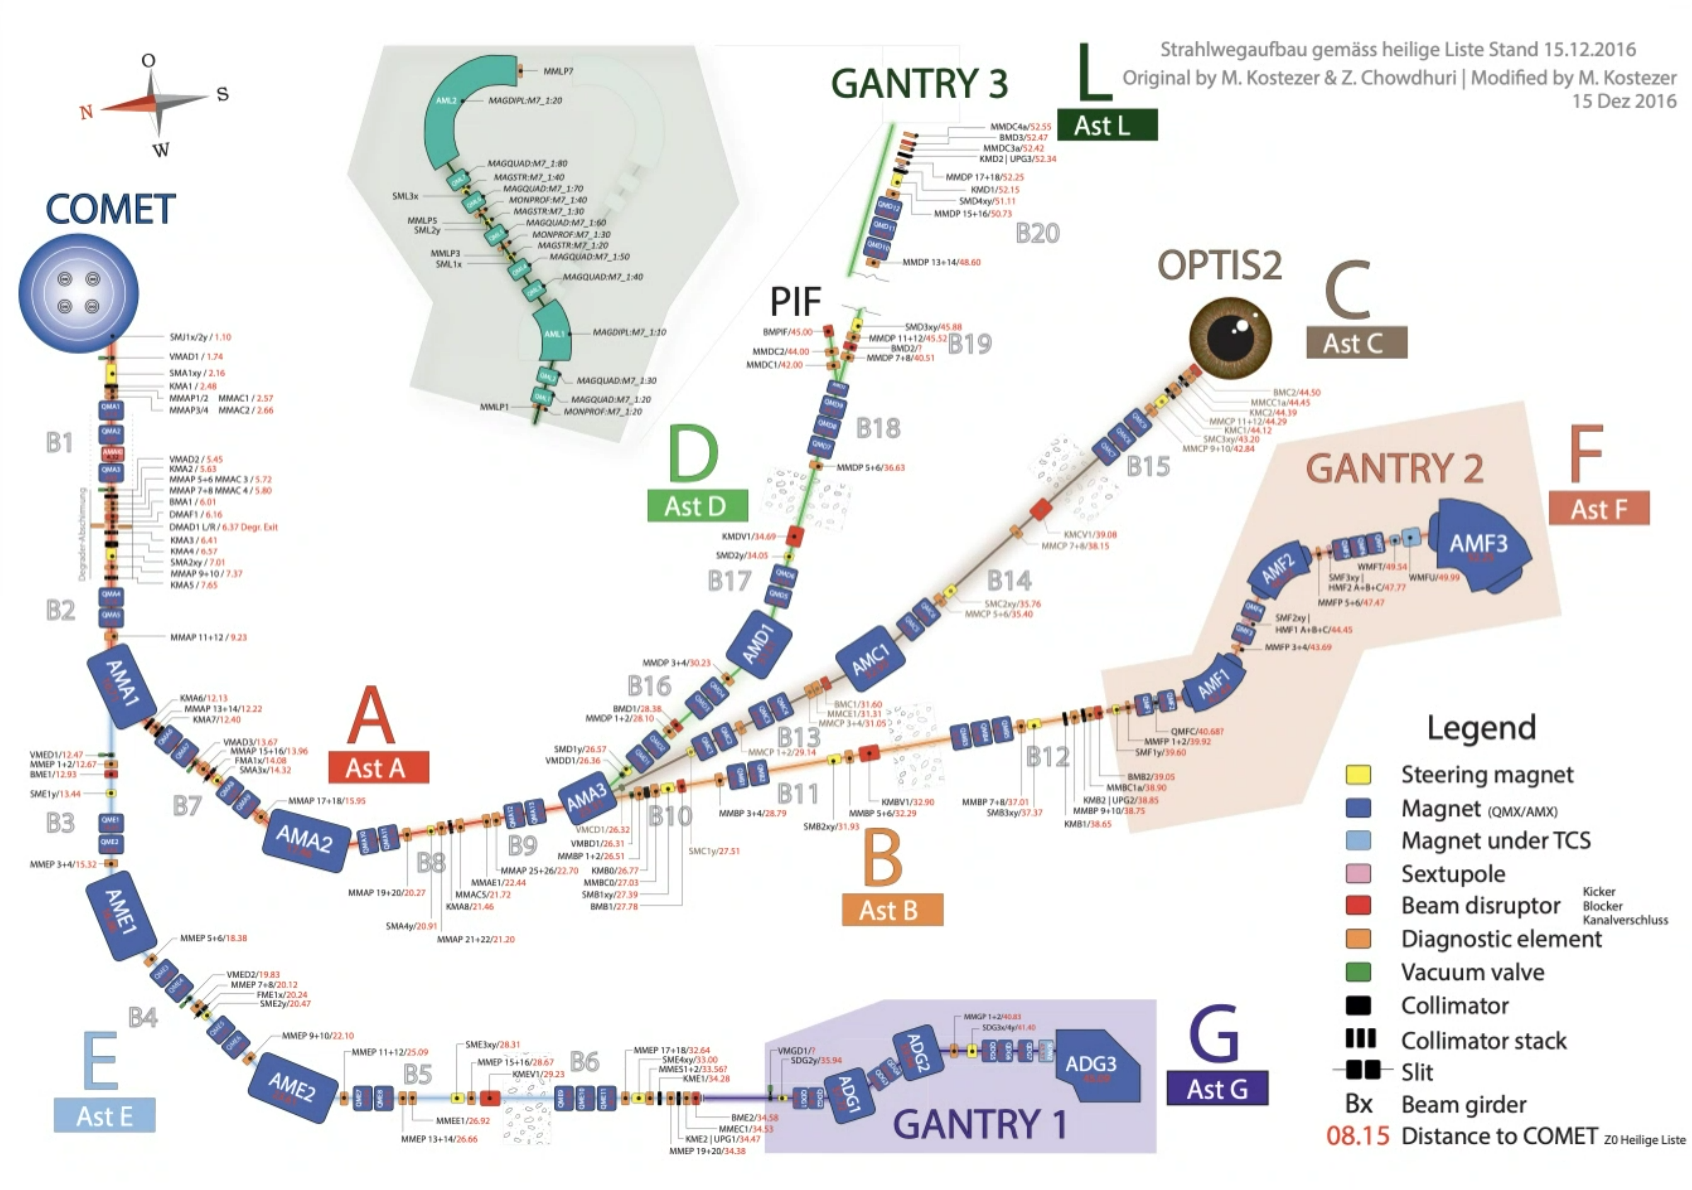
Delivery schema overview for CPT systems (context for BTVS-related analyses).
Implemented Dashboard Views
BTVS KPI & Hysteresis View
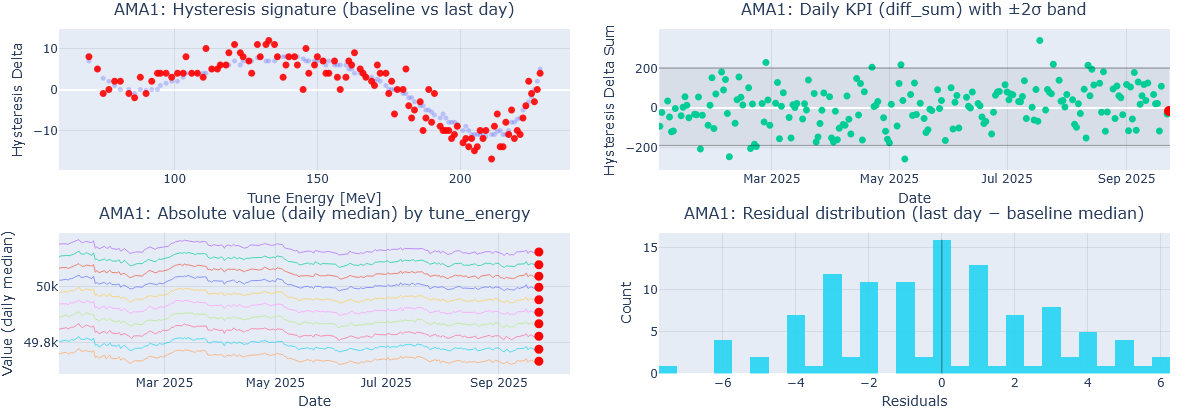
AMA/KPI-hysteresis related dashboard view.
Displays daily sweep trends of selected delivery parameters, including configurable options such as bands and rolling windows for trend inspection across time ranges.
BTVS Pair Drifts View
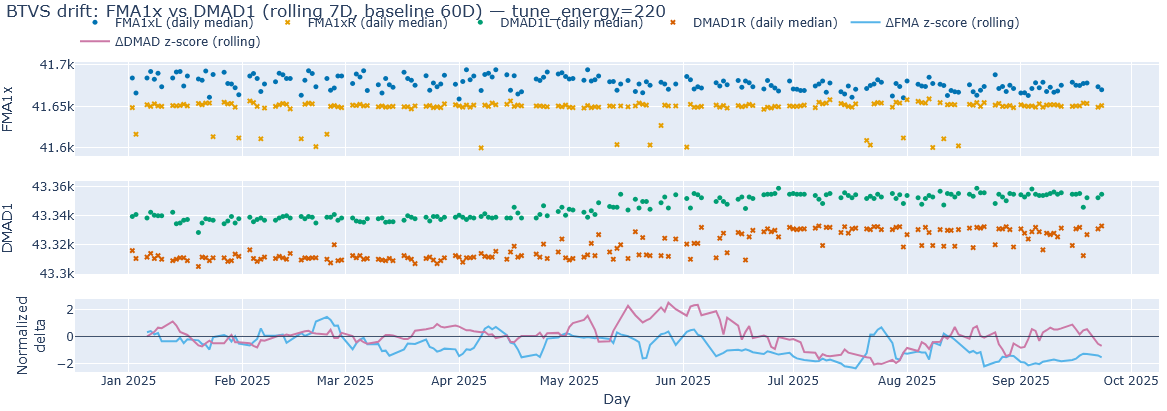
Pair-based drift analysis view.
Pairwise plots for delivery parameters to inspect relative drifts, shifts, and changing relationships between correlated measurements.
User Stats Pair Plots
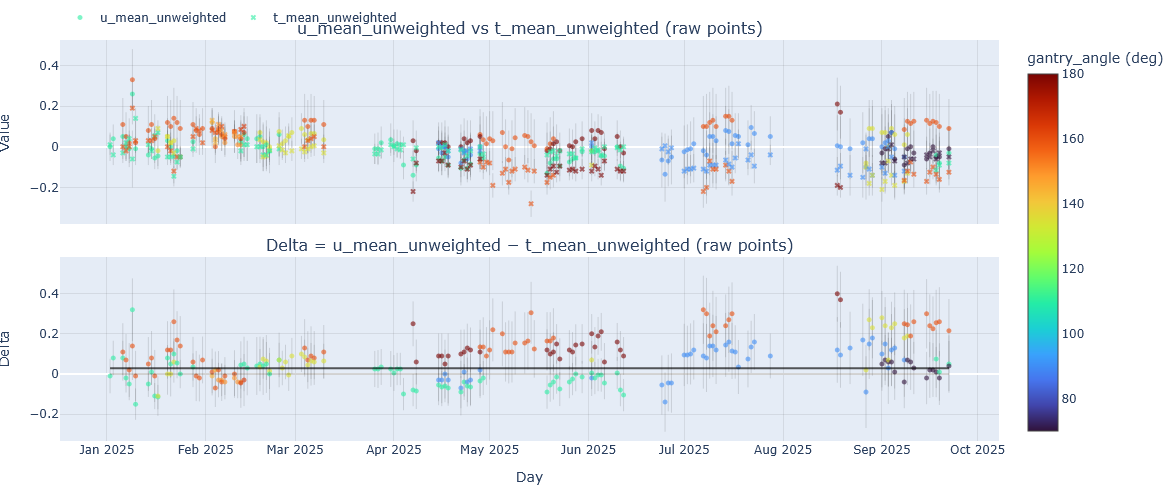
User stats / patient parameter pair-plot view.
Pairwise visualizations for user/patient-related parameters to support exploratory analysis of relationships, distribution changes, and longitudinal patterns.
Interactive Capabilities
- Sidebar configuration (parameter selection, date ranges, bands, rolling windows)
- Hover tooltips, zoom, pan, and reset interactions
- Exploratory analysis within each dashboard view
- Context via warnings and interlocks
- Traceability-supporting identifiers/artifacts in the pipeline design
- Click-to-enlarge image views using FHNW materialbox behavior
Results
The prototype demonstrates that a traceable data pipeline and a performant dashboard are feasible for daily Gantry2 measurement monitoring. It replaces manual ad-hoc CSV plotting with a repeatable processing workflow and dashboard-ready analytical marts.
The main value lies in improved visibility of trends and drift behavior over time, combined with contextual signals (warnings/interlocks) and provenance-oriented processing transparency.
Validated Dataset Window (IP5)
- 2025-01-01 to 2025-09-23
- Delivery parameters: 59,660
- Patient parameters: 4,171
- Warnings: 389
- Interlocks: 182
- Derived parameters (marts): 442,059
Implementation Highlights
A large part of the project effort went into making the solution robust beyond a prototype UI: the data pipeline, dashboard interaction model, and deployment/operations setup were designed together.
1. Data Pipeline (traceability and reproducibility)
- Idempotent processing pipeline for repeatable runs on append-only operational data
- Curated data layers and analytical marts for stable dashboard consumption
- Traceability-oriented processing with run metadata / lineage identifiers
- Design goal: transparent transformation steps instead of ad-hoc plotting scripts
2. Dashboard (visual analytics for monitoring)
- Multiple focused views (KPI/Hysteresis, Pair Drifts, User Stats Pair Plots)
- Interactive exploration via filters, zoom/pan, and hover details
- Contextualization with warnings/interlocks rather than isolated plots
- Design goal: support human interpretation of trends and shifts over time
3. Deployment & Operations (practical operability)
- Test deployment on a Proxmox-hosted VM (AlmaLinux / RHEL-adjacent environment)
- Rootless container-based runtime with systemd user services/timers
- Auto-install shell scripts for reproducible setup and maintenance
- CI-built and optimized images for faster deployment and operational usability
This combined implementation approach was important to validate not only the analytical concept, but also the maintainability and operability of the system in a realistic environment.
Limitations, Learnings, and Outlook
- No full historical coverage in the validated project dataset window
- No on-prem user study / SUS evaluation within IP5 scope
- No mode-aware stratification in the current implementation
- Performance benchmarks not measured on the final production host
Possible next steps (P6 / Thesis)
- Extend historical compatibility (including legacy parser support)
- Run on-prem validation with users, SUS and task-based evaluation
- Add mode/context stratification as first-class filters
- Formal traceability demonstrations for selected views
- Optional alerting / pre-analysis extensions (outside IP5 scope)
Technologies
- Data pipelinePython, pandas, DuckDB, pyarrow / Parquet, SQL marts
- DashboardDash, Plotly
- DeploymentPodman (rootless), systemd --user, shell scripts
- OperationsTimers, service units, versioned image tags
Partner Institute

PSI CPT (Center for Proton Therapy, Paul Scherrer Institute)
https://www.psi.ch/en/protontherapy
Team
Student
Christoph Elmiger
christoph.elmiger@students.fhnw.ch
Supervisors
Prof. Dr. Arzu Cöltekin
arzu.coltekin@fhnw.ch
Cédric Merz
cedric.merz@fhnw.ch
Visual Context
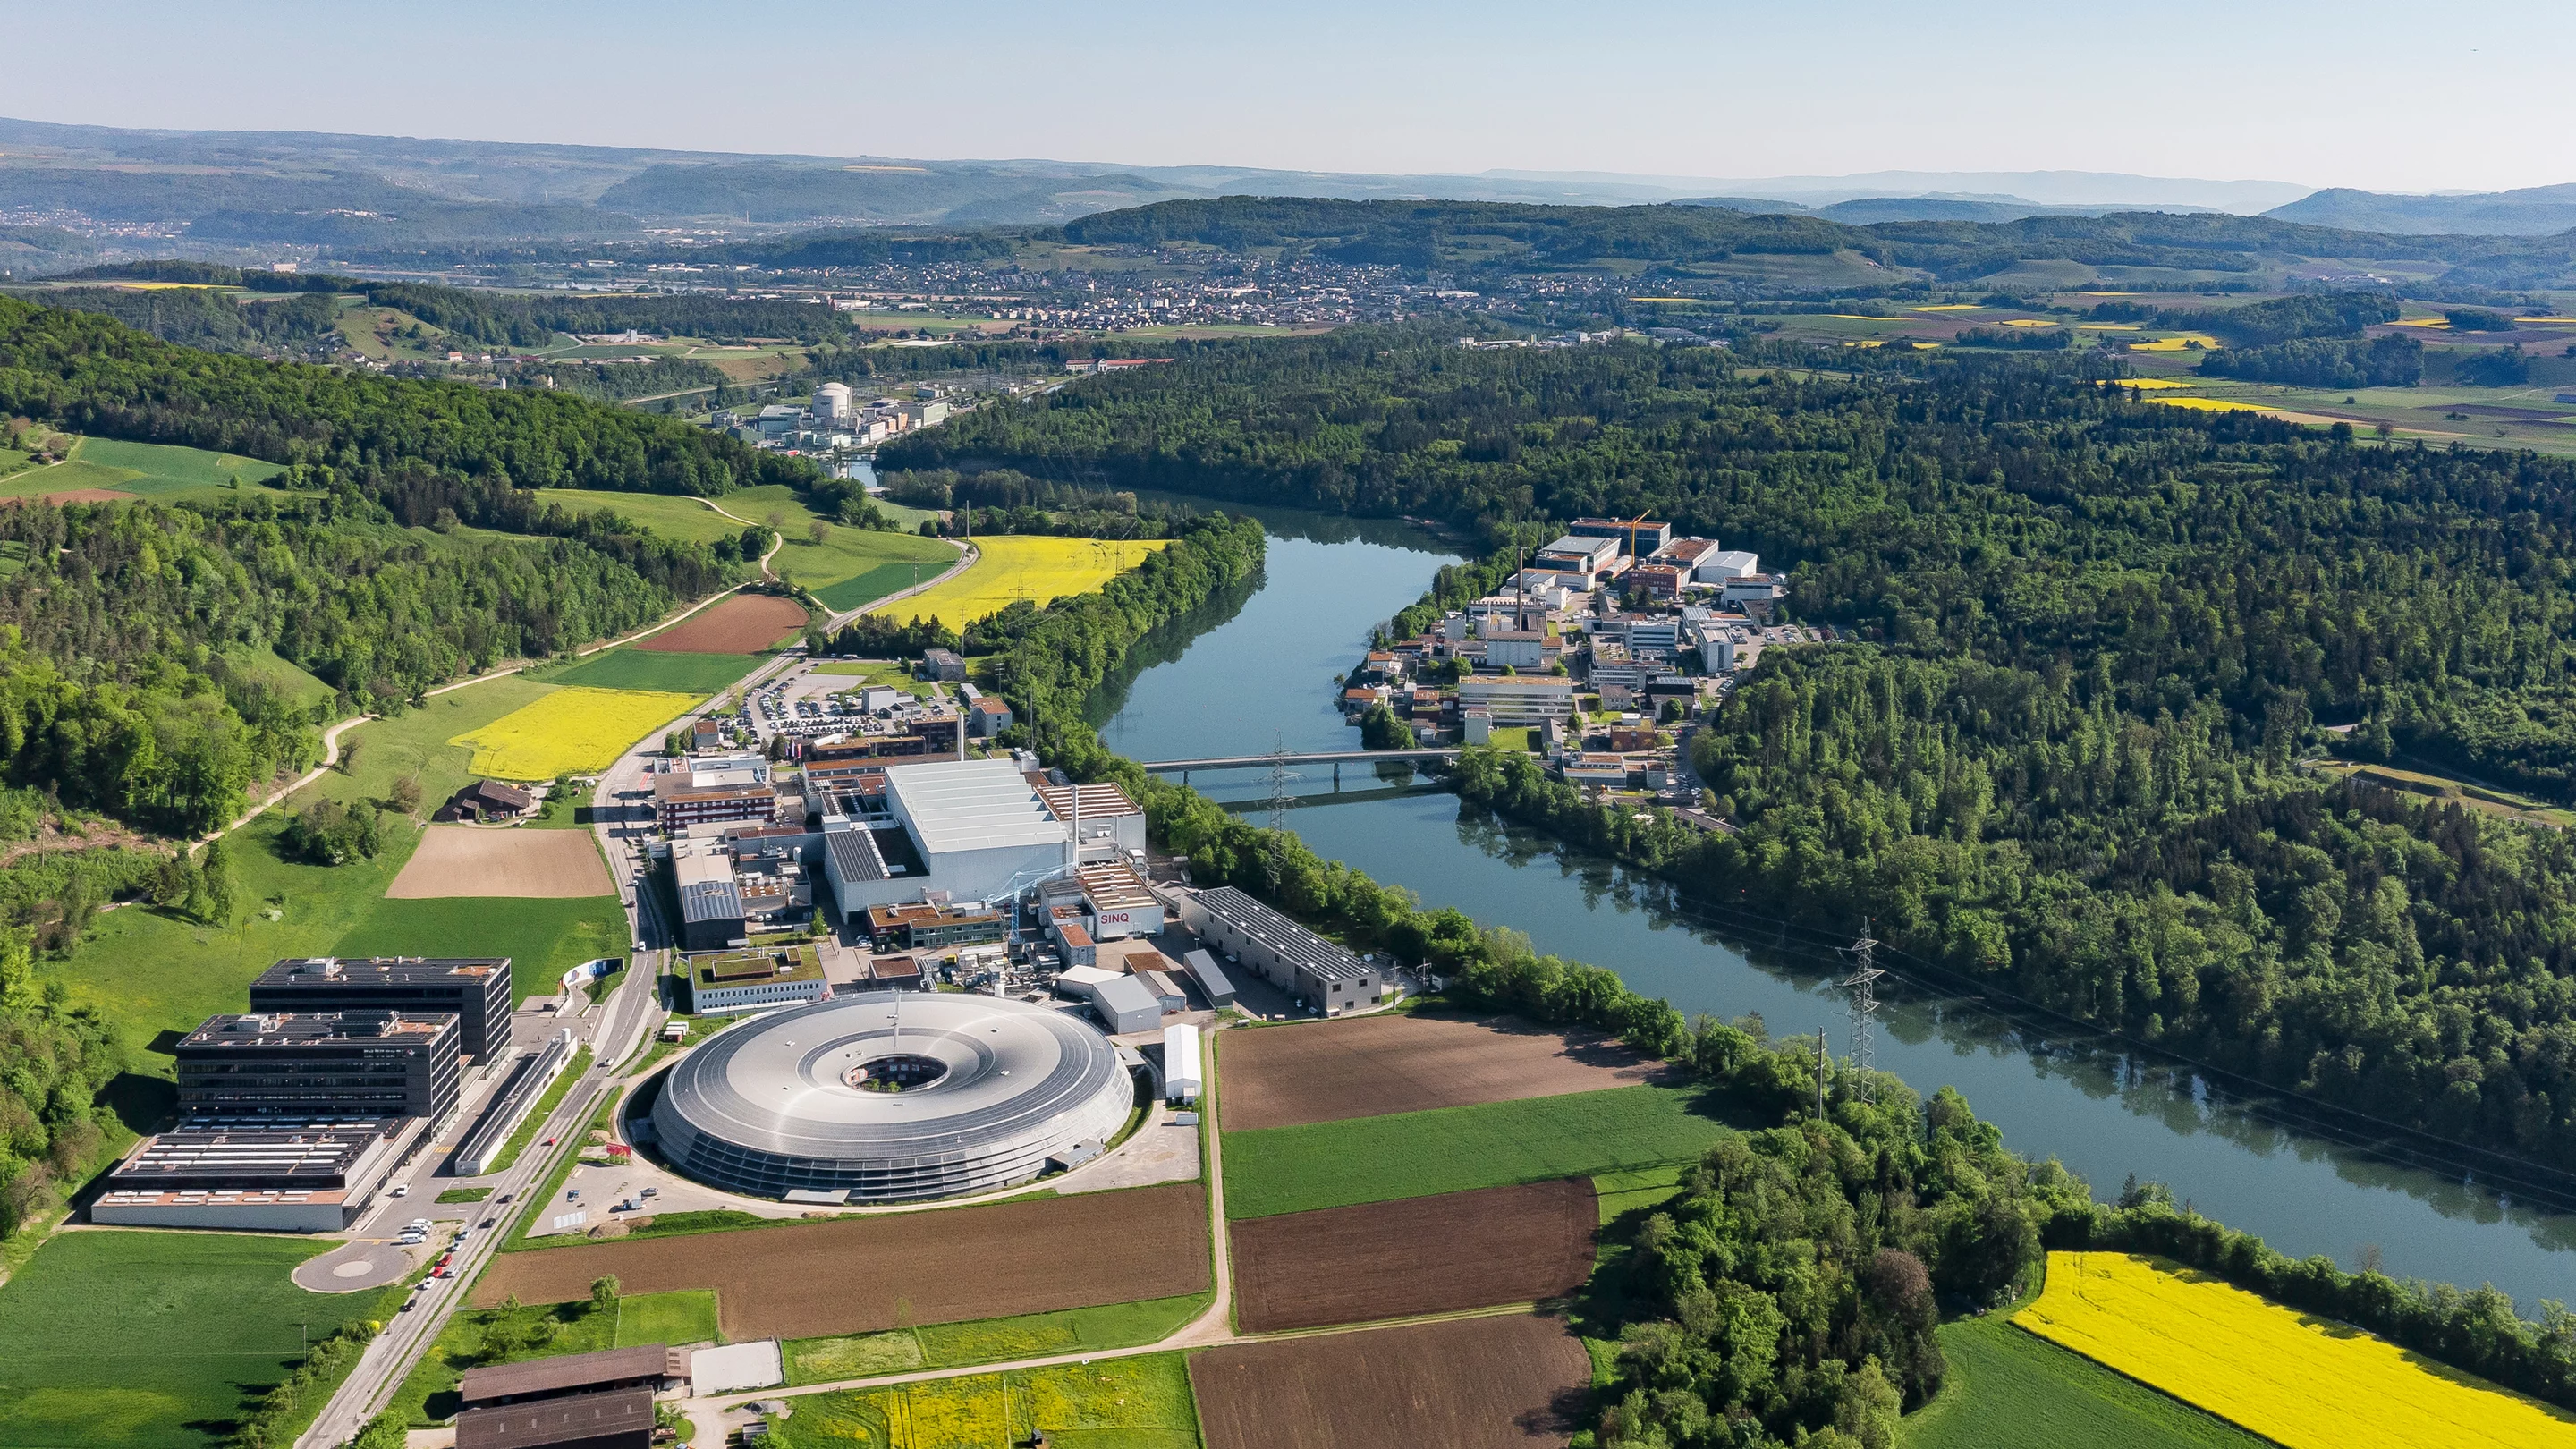
PSI campus (aerial view).
Gantry2 at PSI CPT.
Dashboard prototype overview.