
Troubleshooting Network Problems With an AI-Driven Multi-Agent System
Finding out why a network is broken can be a time consuming task. This project built a multi-agent system that troubleshoots a live network. The system was measured by doing 300 experiments, to see what kind of faults can be troubleshot, how fast it gets there and what it costs.
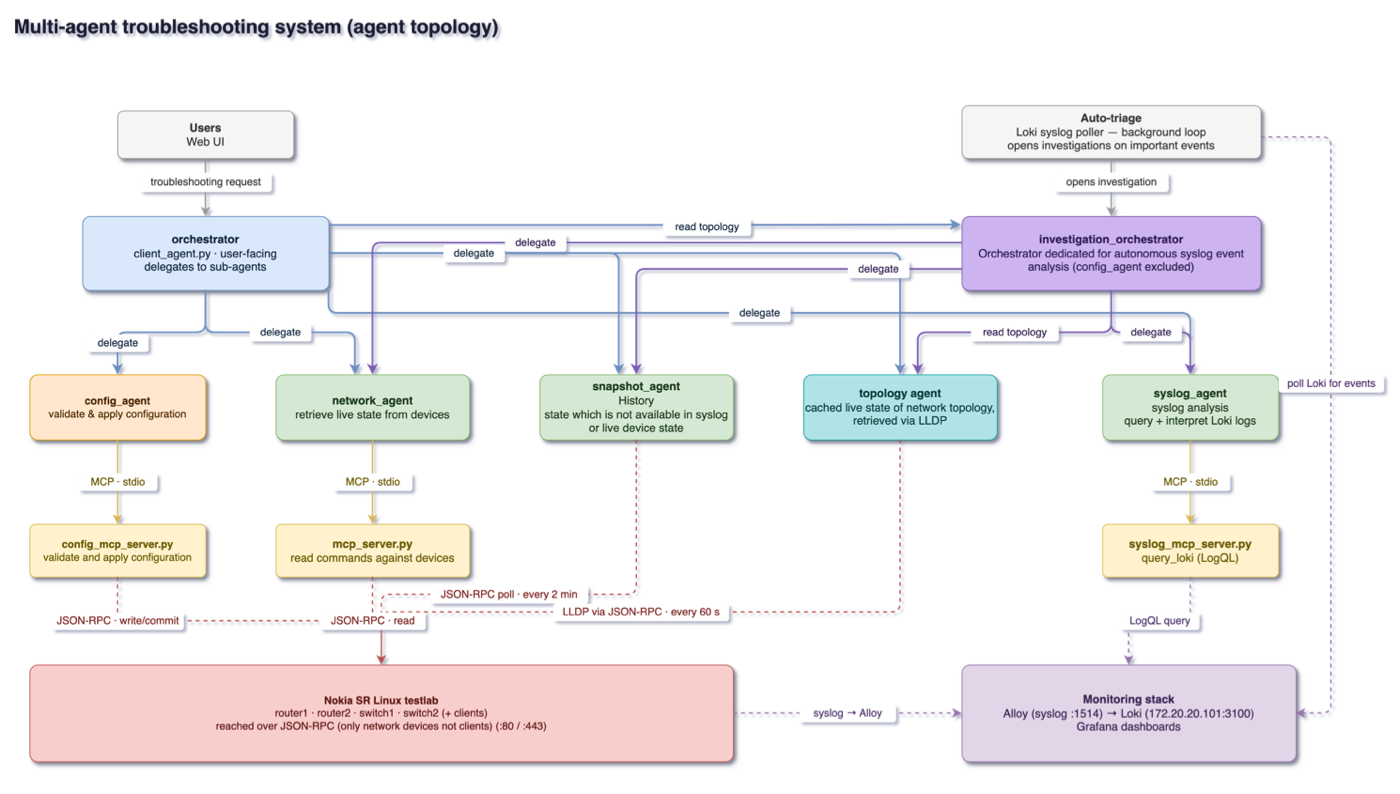
Architecture of the multi-agent troubleshooting system
Initial situation
When a service reports a problem or a computer loses its connection, a network engineer has to work through the network device by device. Interface states, routing tables, address caches and log messages are checked one after the other until the fault can be located. The way from the first symptom to the true cause takes many steps and a lot of time. The larger a network becomes, the more this diagnostic effort turns into operating cost and into a longer outage for everyone affected.
Recent advances in large language models (LLMs) and the ability for an LLM to call external tools, observe the results and decide on the next action, offers a new way to possibly reduce this troubleshooting effort (using AI-Agents). Instead of a single-agent design, a multi-agent system can split the problem into smaller parts and assign them to specialised agents. Whether such a system can be used to assist in troubleshooting or even find problems autonomously is an open question which this work tries to answer.
Problem statement / Project goal
The goal was to design and build such a multi-agent system and then to use it as a measuring instrument. The interesting question is not only whether it works at all, but where its limits are. The project was therefore guided by five questions:
- How much time can be saved compared to manual troubleshooting?
- Problems of which difficulty level can be troubleshot?
- What is the success rate for a correct analysis at each difficulty level?
- What does an automated diagnosis cost, and what can be saved with it?
- How much does all of this depend on the choice of the language model?
To answer them, a catalogue of ten reproducible scenarios was built. One healthy network without any fault, which checks that the system does not invent problems, and nine injected faults in three difficulty levels. Every scenario was run against six language models from three price classes, five times each, which results in 300 runs. Each run was rated by hand against the known true cause.
The test network

Four Nokia SR Linux devices and four clients, virtualised with containerlab. Each experiment injects exactly one known fault into this healthy baseline and restores it afterwards.
Talking to the system
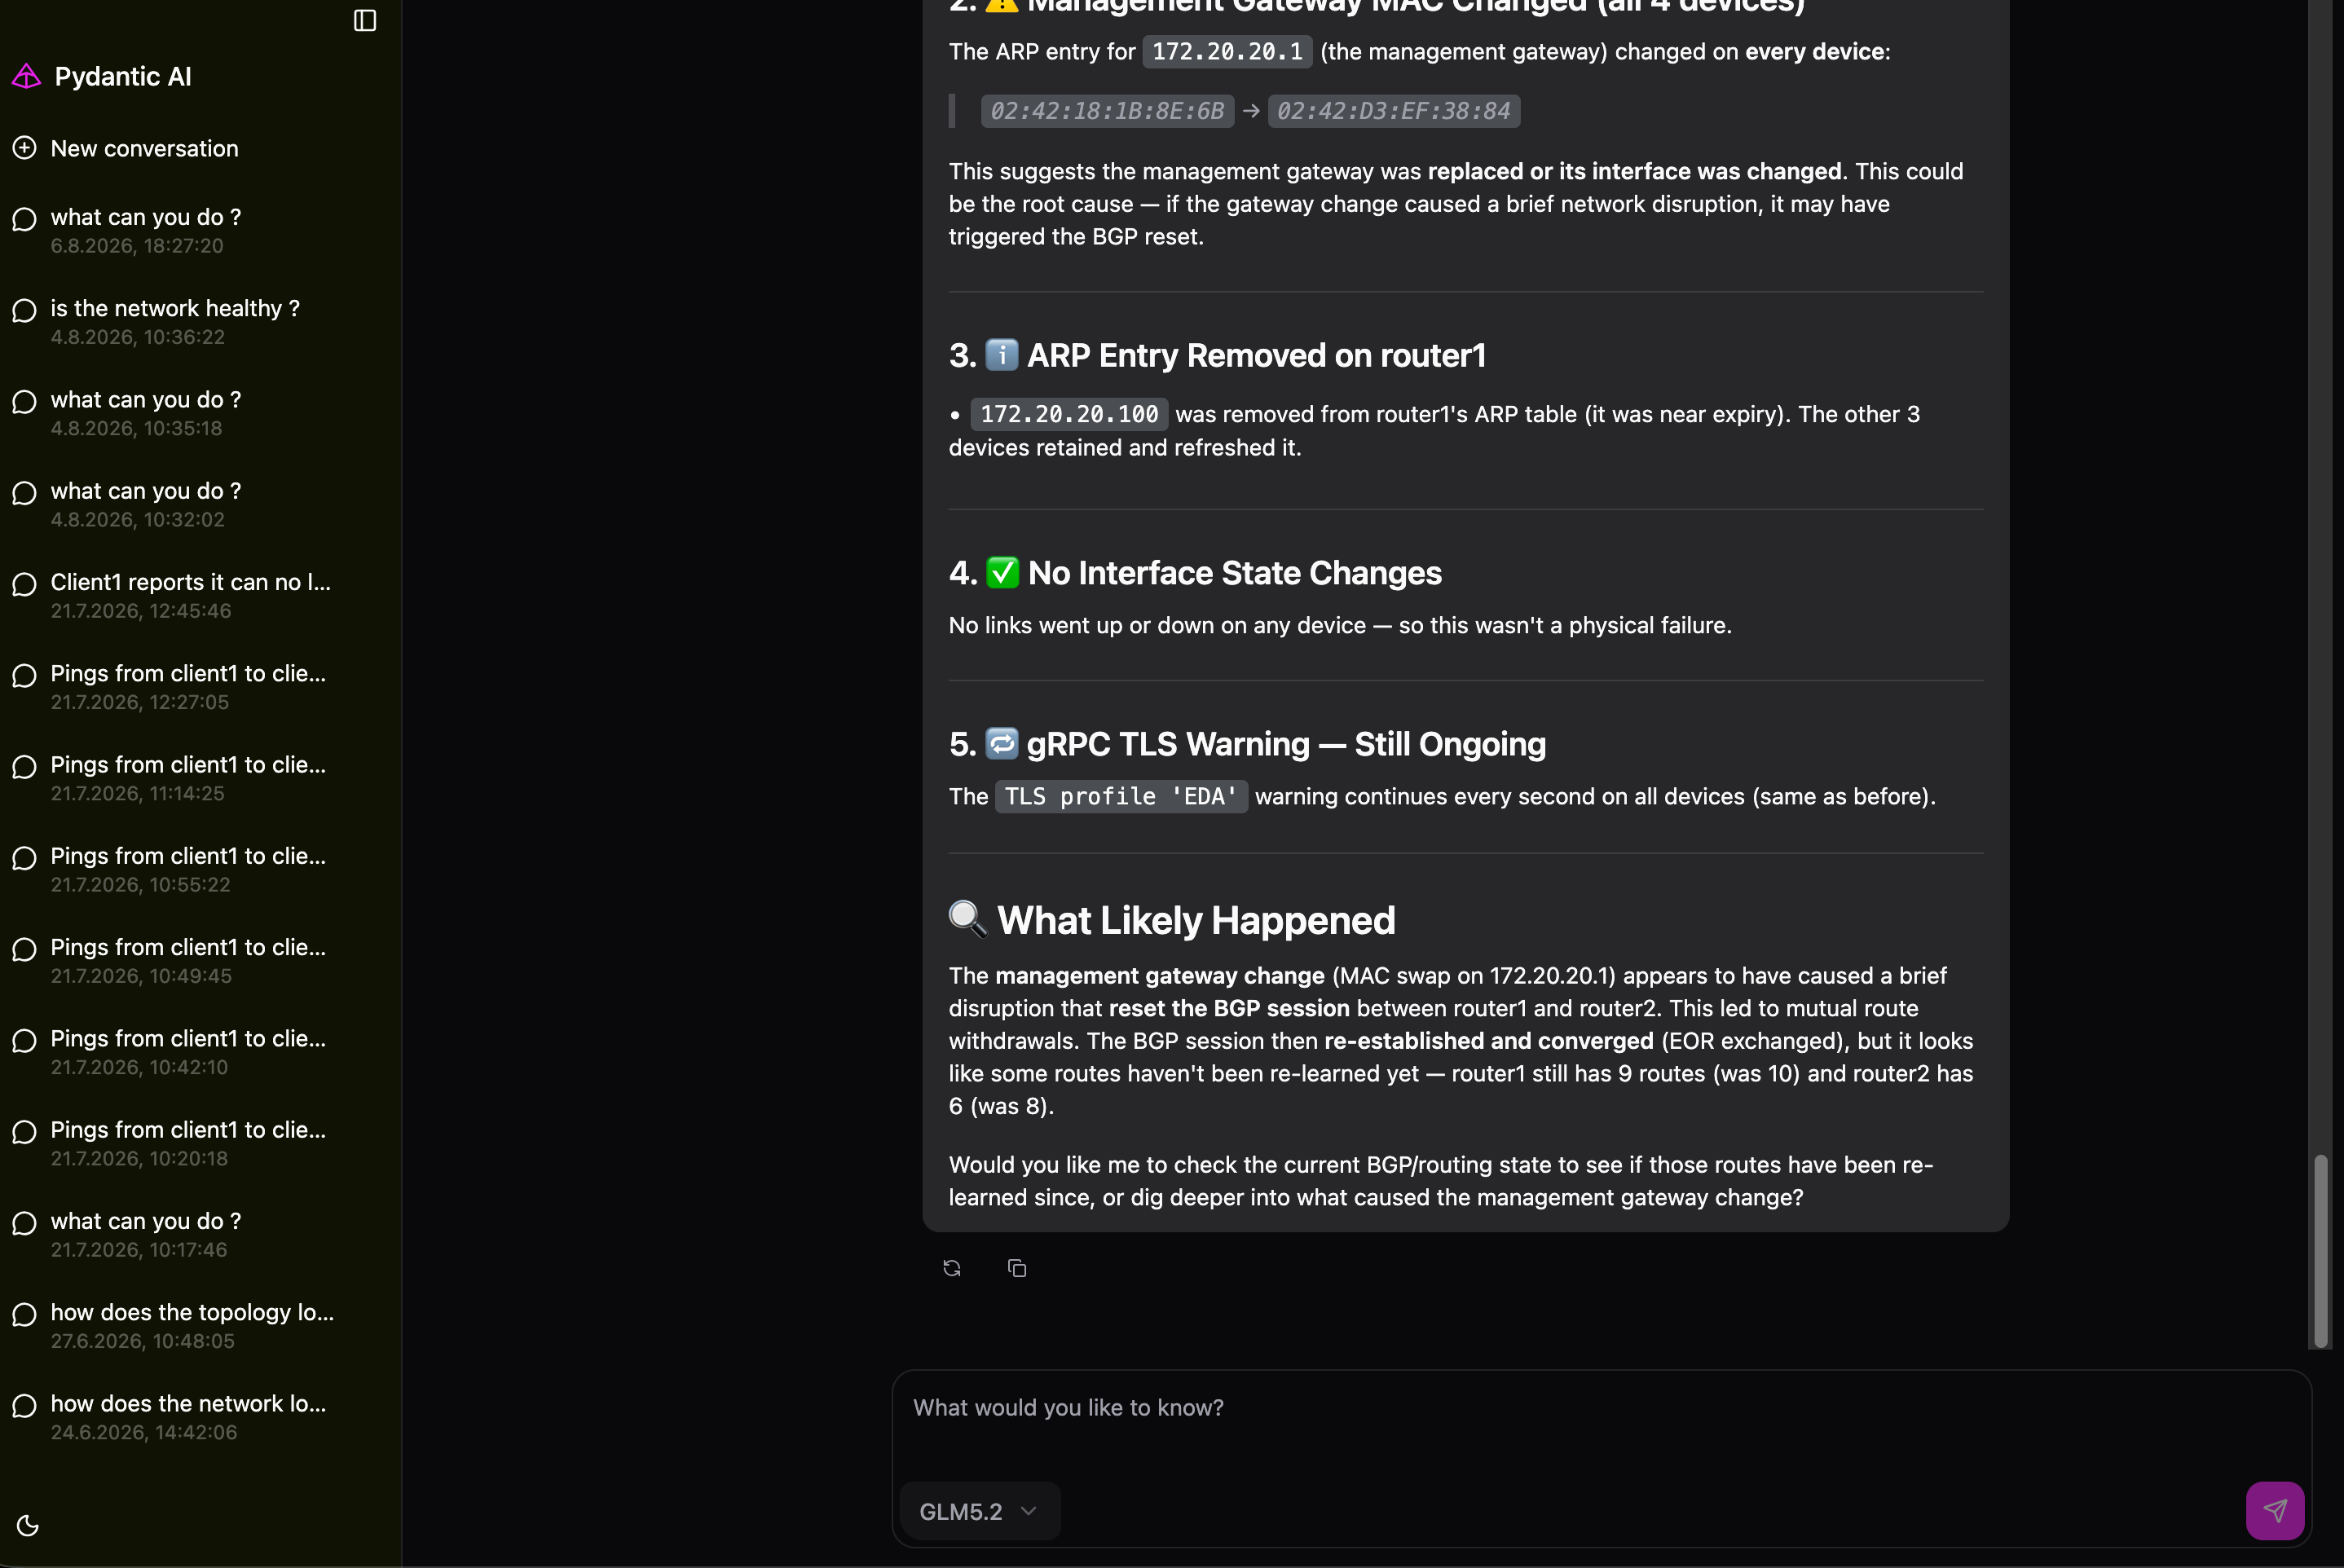
The chat interface for interacting with the multi-agent system.
Automatic investigations
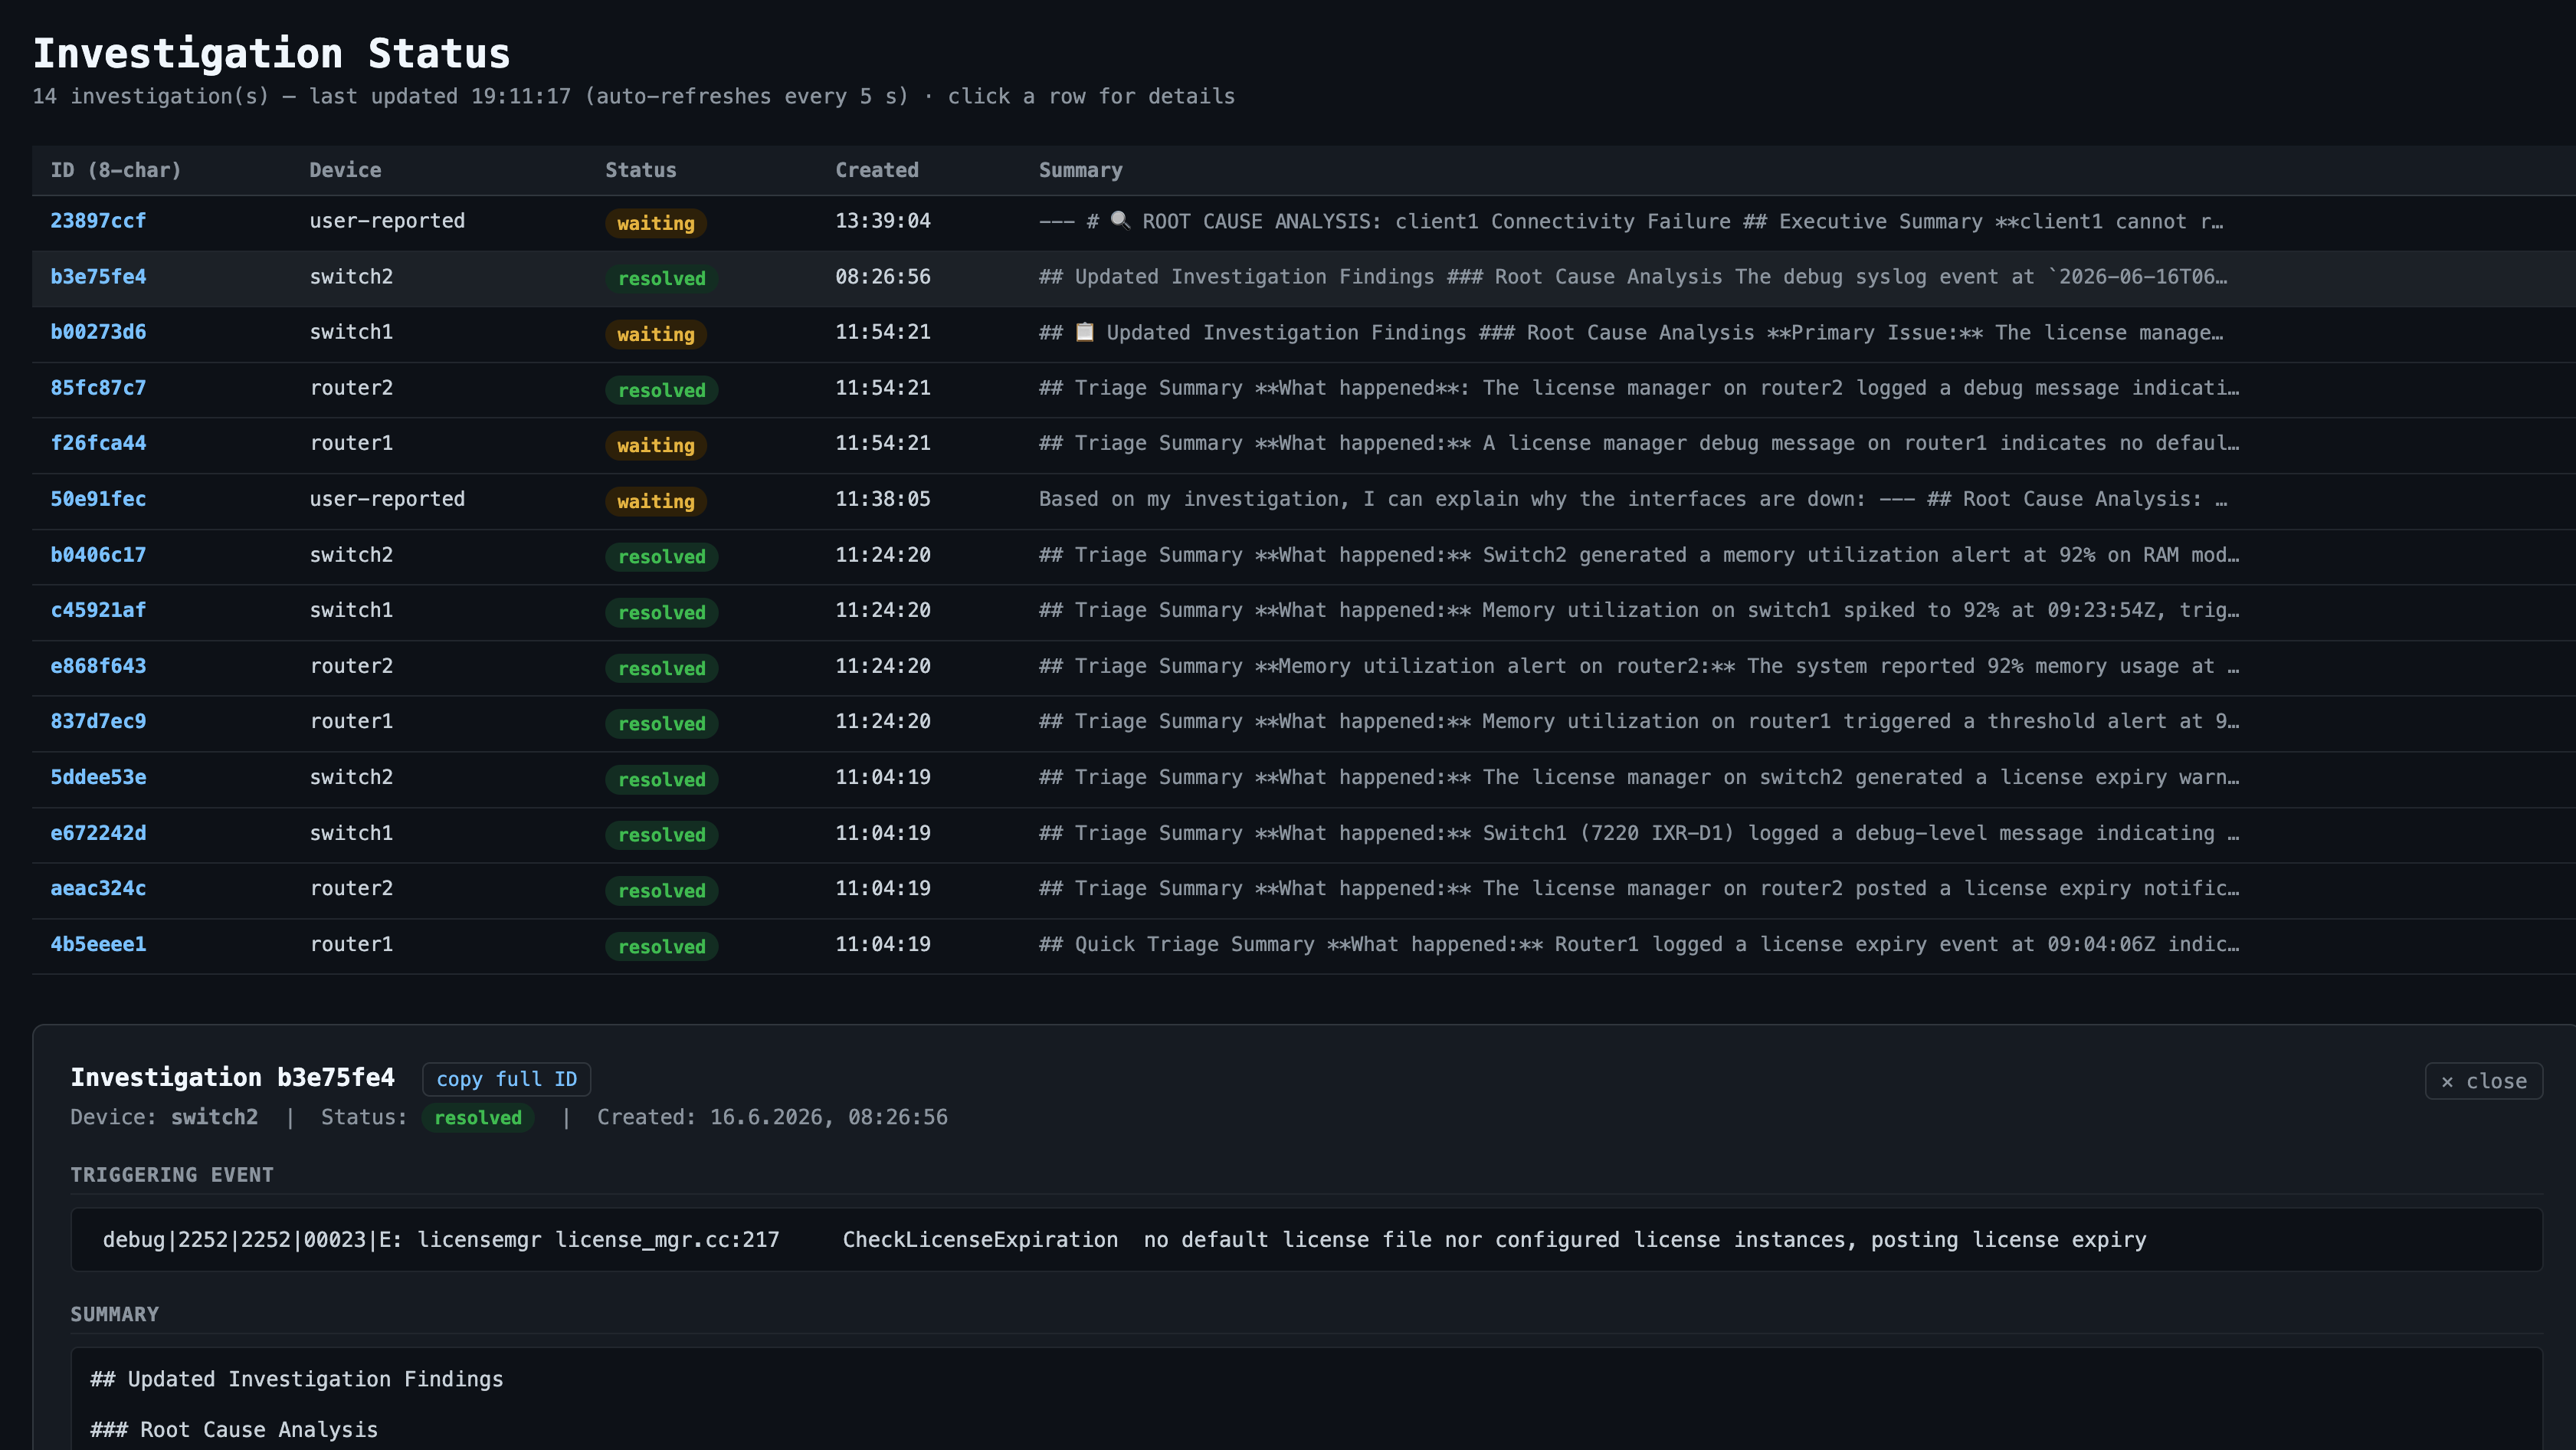
The overview of the automatic investigations. Each configured log message (severity level) generates its own case, with the triggering event and a first report attached.
Which faults were found
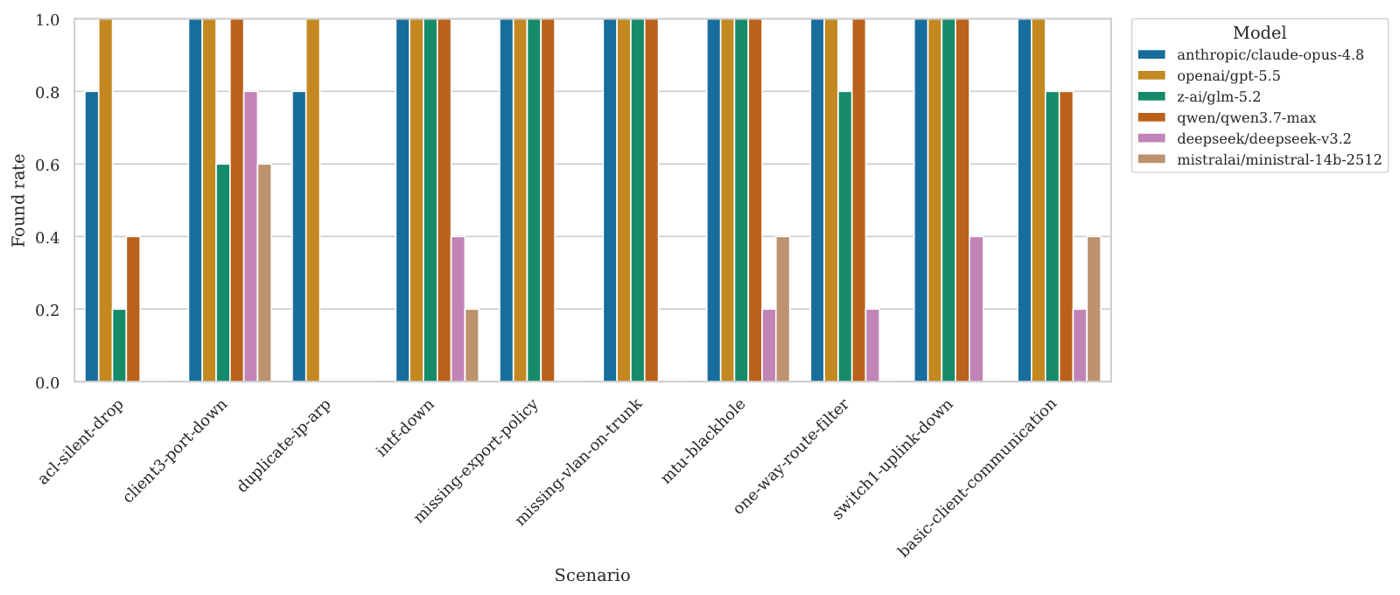
Share of runs that ended with the correct cause, per scenario and model.
Cost against success
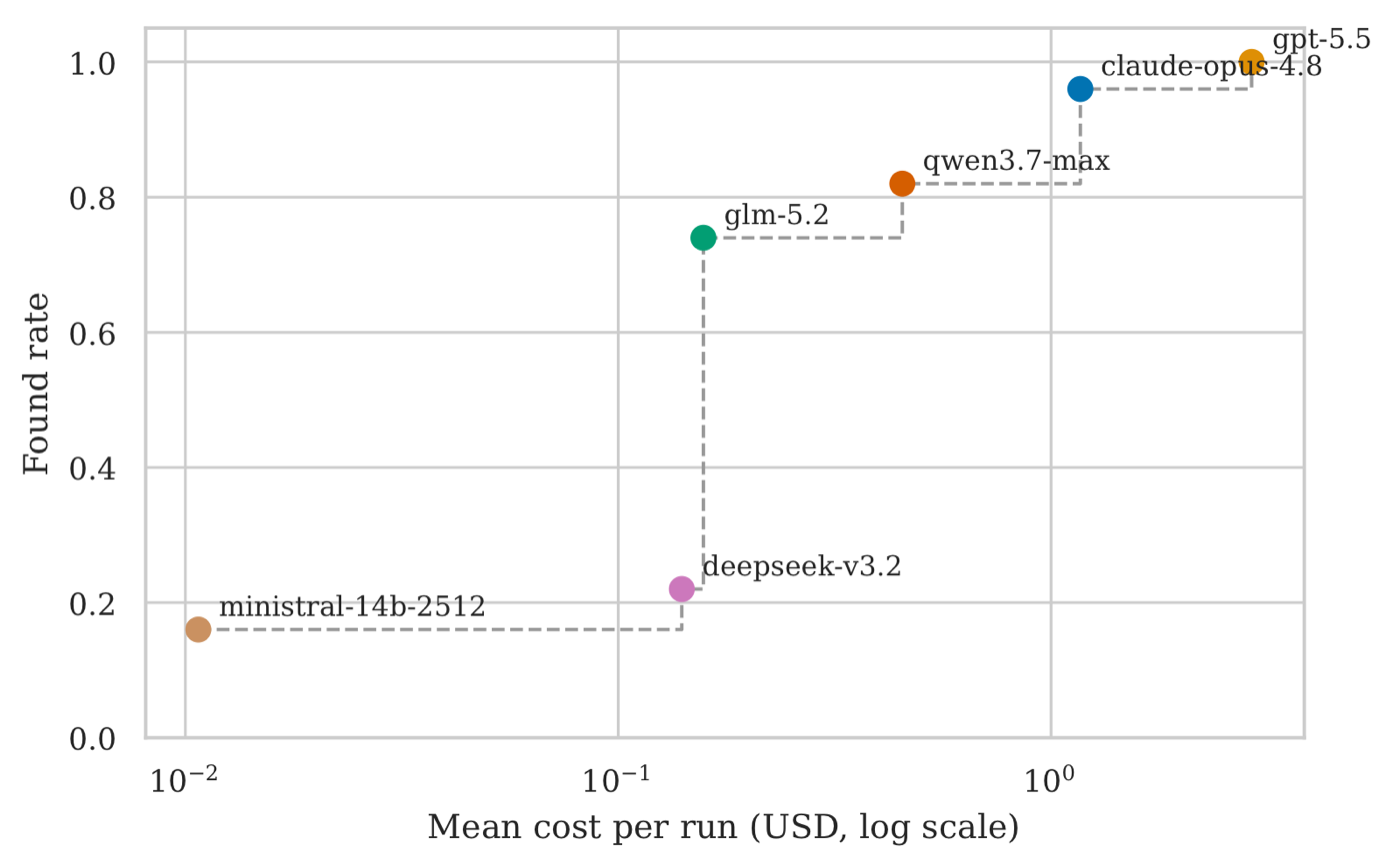
Average cost of one investigation against its success rate. Every step up in price buys accuracy, but the cheapest models are far too unreliable to be of use.
Solution developed and its benefits
The result is a system that an engineer talks to through a simple chat window, shown in the screenshot above. An orchestrating agent takes the troubleshooting request in plain language, breaks it into sub-tasks and hands them to specialised agents. Each of these agents has its own narrow job and only the tools it needs for it. This keeps every agent focused and prevents a single agent from having to hold the entire investigation in its head at once.
- Orchestrator: takes the request, distributes the work and assembles the final answer based on the feedback of the sub-agents
- Network agent: reads the current state from the devices (read only)
- Topology agent: checks the live topology (via LLDP) and compares it against a target topology
- Syslog agent: searches and interprets the log messages of the whole network (through central syslog collection)
- Snapshot agent: captures state which later can't be seen anymore in syslog or in live device state (such as route table changes or ARP table changes)
- Configuration agent: the only agent allowed to change a device (not part of the evaluation)
Most of the agents do not talk to the devices directly. They use tool servers built on the Model Context Protocol, which is a standard way of giving a language model a safe, well-described set of actions. The devices themselves are real Nokia SR Linux systems running in a virtual lab, so the agents see real device behaviour rather than a simulation.
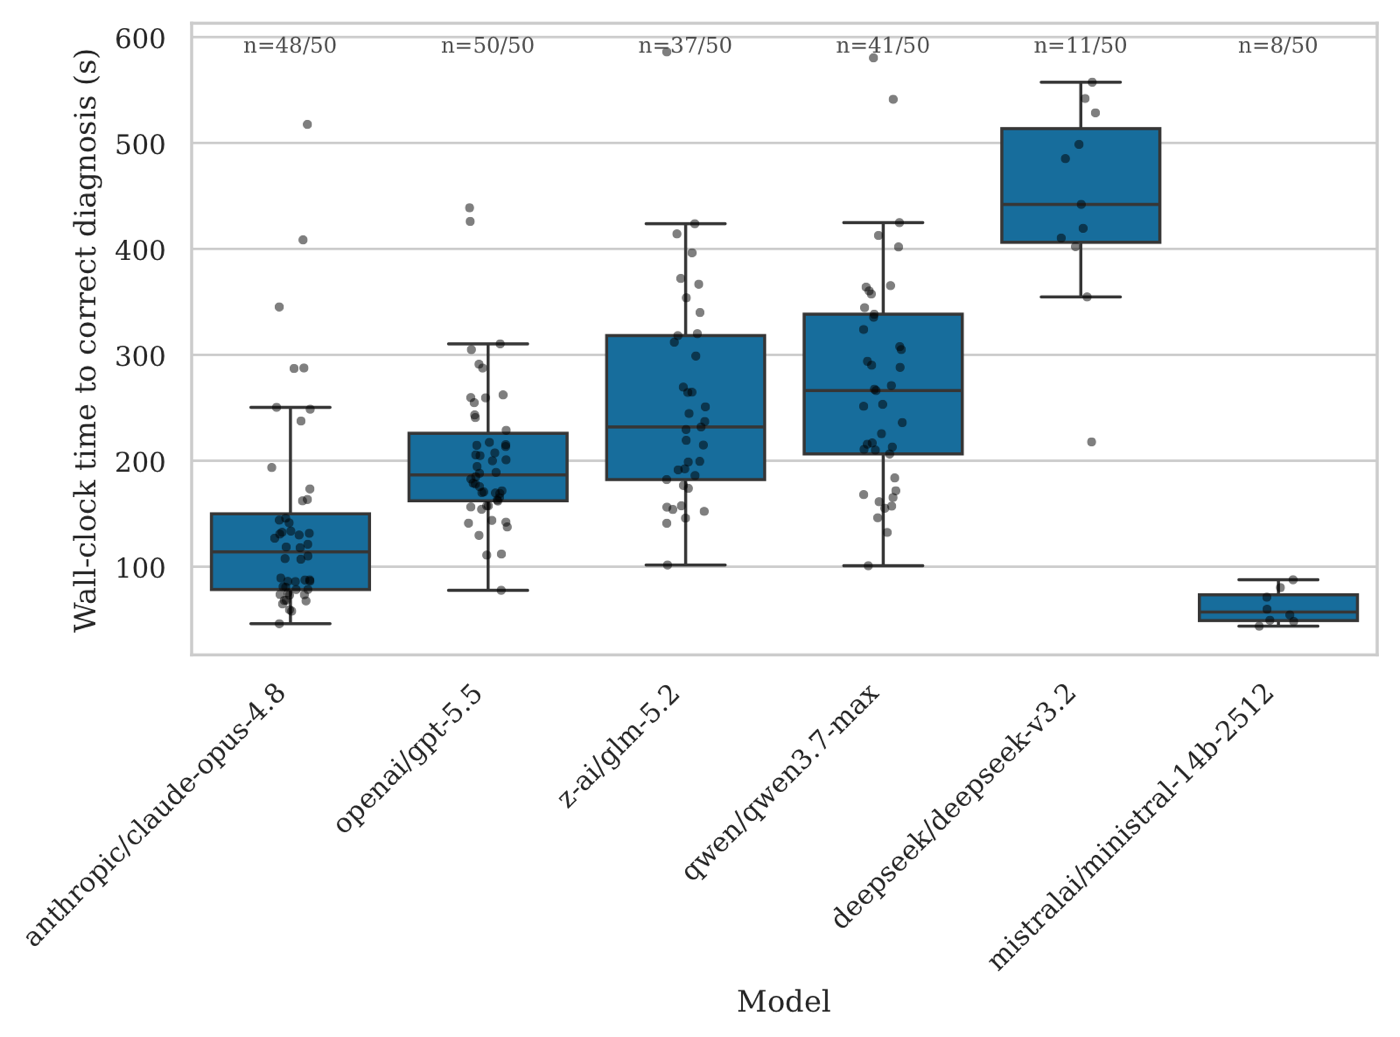
Time from the question to a correct diagnosis, per model
The measurements gave a clear picture. Of the two strongest models, one found the true cause in all 50 of its runs and the other in 48 of 50, across all three difficulty levels, and they usually needed two to three minutes for it. The middle price class solved the easy faults almost perfectly but reached only 74 to 82 percent overall, and it failed mostly by running out of time rather than by naming a wrong cause. The cheapest models were not usable at all. One was too slow to ever finish, the other answered within a minute but was usually wrong, and it even reported faults in the healthy network. Among the models that are actually usable, a correct diagnosis cost between 21 cents and 2.91 dollars in API fees.
What this is worth in practice follows from the comparison with manual work. A downed interface is quick to find either way, so little is gained there. The difficult faults are the interesting ones. Their manual diagnosis is estimated at one to two hours, while the system stays at a few minutes almost regardless of the difficulty. Measured against an assumed engineer rate, the saving per difficult incident is roughly a factor of three to twenty. With the very same agent logic, the success rate ranges from 16 to 100 percent depending only on which model is put behind it.
A second, independent part of the project shows that the same building blocks also work without any human trigger. A background component watches the incoming log stream, and when a noteworthy message appears it opens an investigation on its own, produces a first report and stores it. All of these cases land in a shared overview, shown above. There an engineer can later pick one up and continue from where the automatic investigation stopped, instead of starting over.
Key terms
- Multi-agent systemA system in which several autonomous programs, called agents, cooperate on a task or goal
- AI agentA piece of software that uses an LLM to decide what action to do next
- Model Context Protocol (MCP)An open standard that connects AI applications to external tools and data sources through one uniform interface
- Pydantic AIAn open-source Python framework for building applications and agents on top of large language models
- containerlabAn open-source tool that builds virtual network labs from containerised network operating systems, here Nokia SR Linux
- BGP, VLAN, ACL, MTU, ARPCore network mechanisms: route exchange (BGP), traffic separation (VLAN), packet filtering (ACL), packet size limits (MTU) and address resolution (ARP), the places where the nine faults were injected
- syslogThe standard protocol with which network devices and servers report their log messages to a central collector, here Grafana Loki
- Large Language Models (LLM)Neural networks trained on vast amounts of text so that they can understand and generate language, here compared across six models from three price classes: Claude Opus 4.8, GPT-5.5, GLM-5.2, Qwen3.7-Max, DeepSeek-V3.2 and Ministral-14B
Customer
Internal FHNW Project
Institute for Mobile and Distributed Systems (IMVS)
University of Applied Sciences Northwestern Switzerland
Bahnhofstrasse 6
5210 Windisch
IMVS Website
Team
Dominik Krebs
Advisors
Christopher Scherb
Luc Heitz