
Predicting solar flare GOES flux from STIX data
Helping scientists describe solar storms on the far side of the Sun in the same language used for space-weather alerts on Earth — with a live web demo built at FHNW.
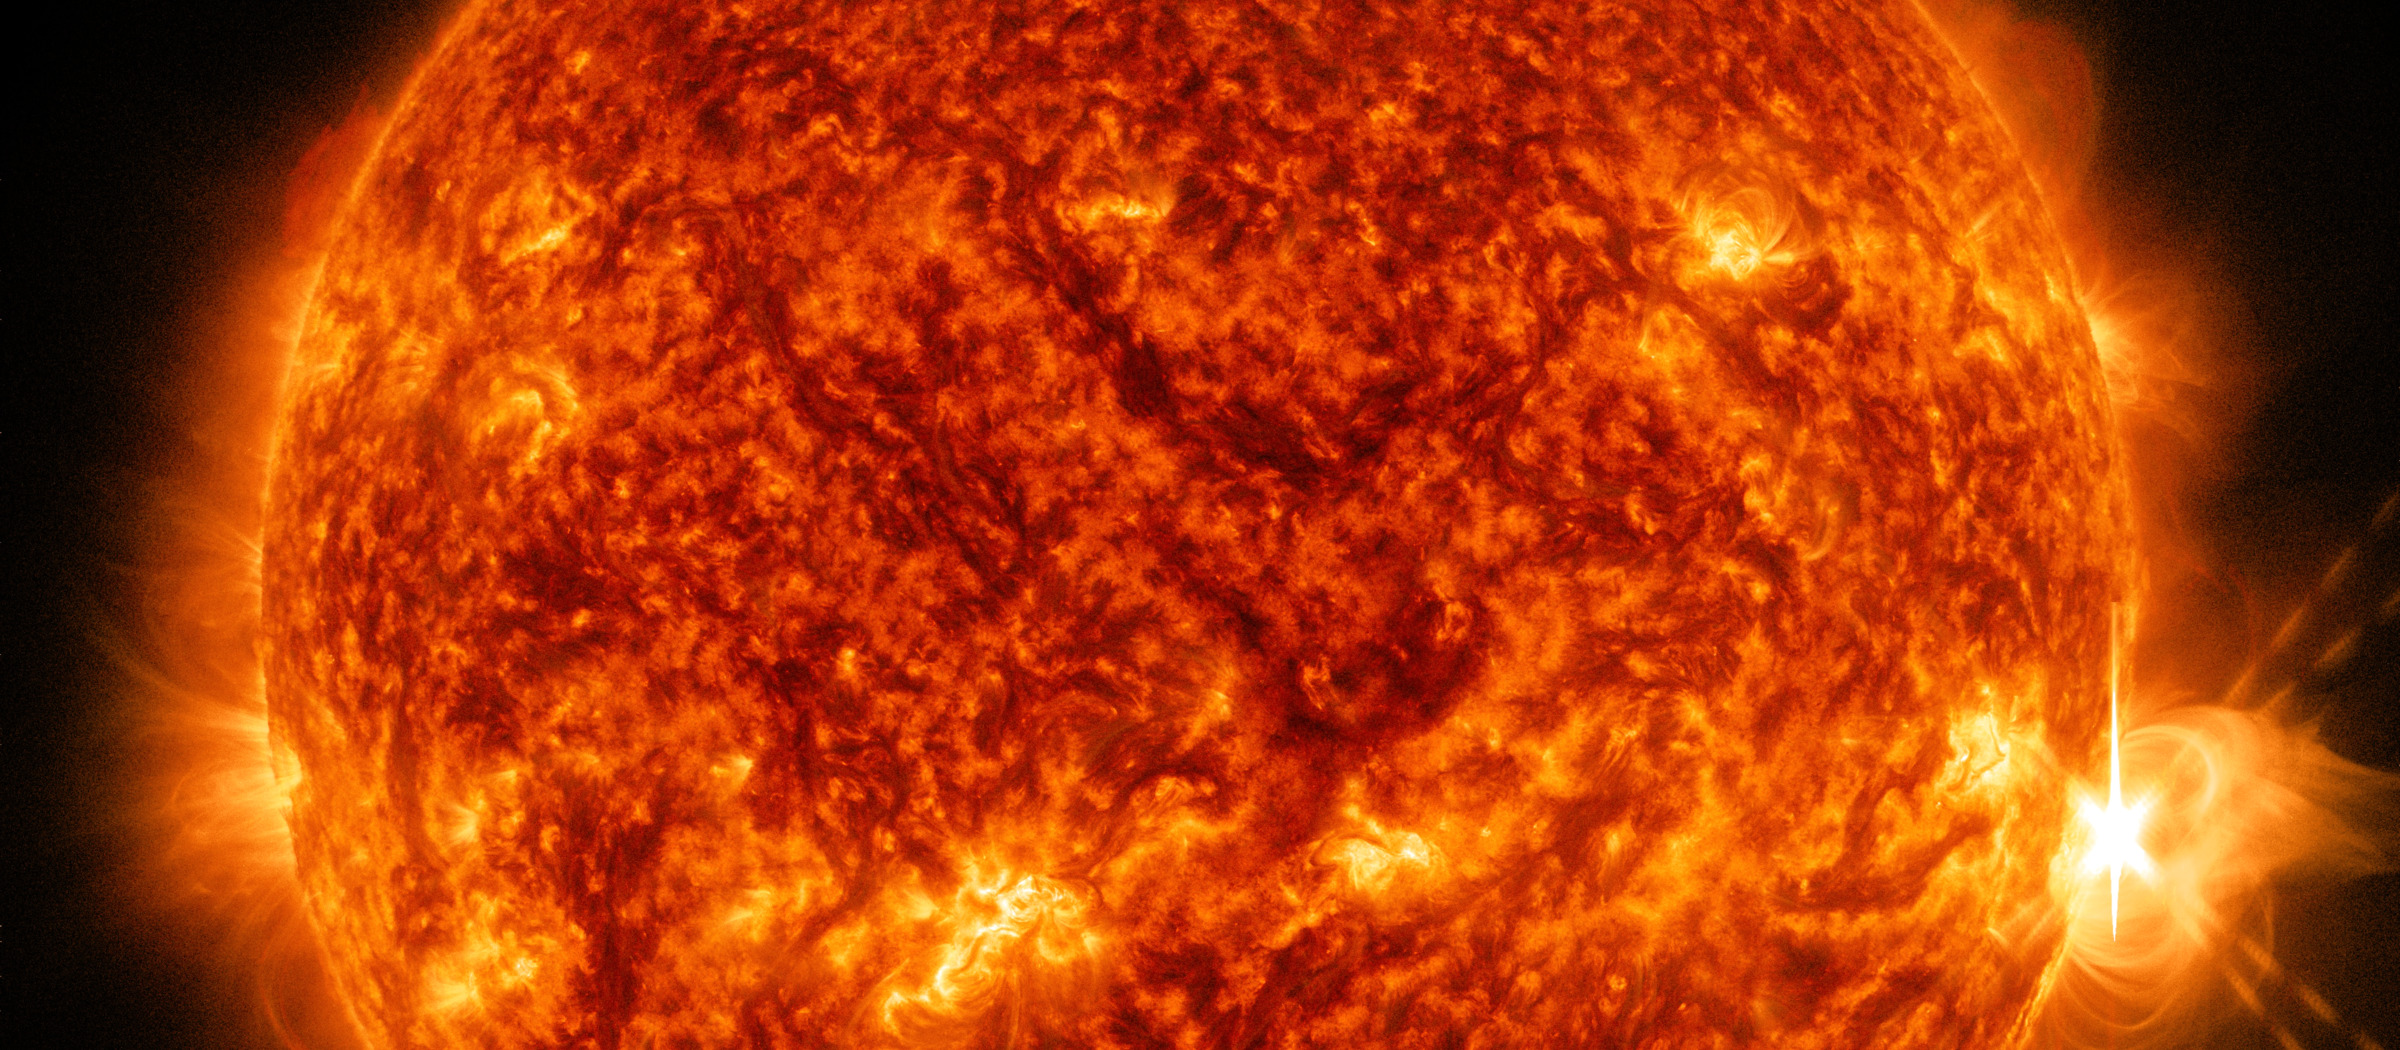
When the Sun erupts, the effects can reach technology we rely on every day. Image: NASA/SDO.
Initial situation
The Sun regularly releases sudden bursts of energy — solar flares. Strong events can disturb satellites, radio communication, aviation routes, and even power grids. For more than forty years, operators and researchers have used a simple, shared scale to describe how strong a flare is. That scale comes from weather satellites looking at the Sun from Earth’s neighbourhood (the GOES mission). Everyone in the field understands what a “C-class” or “M-class” flare means, because that scale is the common language of space weather.
There is a catch: those Earth-orbit satellites only see the half of the Sun that faces us. The other half stays hidden. FHNW helped build a special X-ray instrument called STIX for ESA’s Solar Orbiter spacecraft. From its unique orbit, Solar Orbiter — and STIX — can watch flares that Earth never sees. That is scientifically precious: tens of thousands of events, including many on the far side of the Sun.
But STIX and GOES are different instruments. They measure different parts of the X-ray spectrum and sit in different places in space. You cannot simply copy a STIX reading onto the familiar GOES scale. Without a translation, far-side flares remain hard to compare with the alerts and archives that industry and research already use.
Problem statement / Project goal
Our goal was practical: teach software to translate STIX observations into the same kind of strength curve that GOES would have reported — if GOES had been able to see the flare. We train that translation on events both instruments observed together (the Earth-facing side, where we know the “correct” GOES answer). Once the software works well enough, we can apply it where only STIX has a view.
For FHNW and future project partners, the value is clear: better reuse of Solar Orbiter data, a bridge to the language of operational space weather, and a working product — not only a research notebook. We set out to improve the data foundation from an earlier student project, compare several smart prediction approaches, and put the result into a website anyone can try in the browser.
Try it in the browser
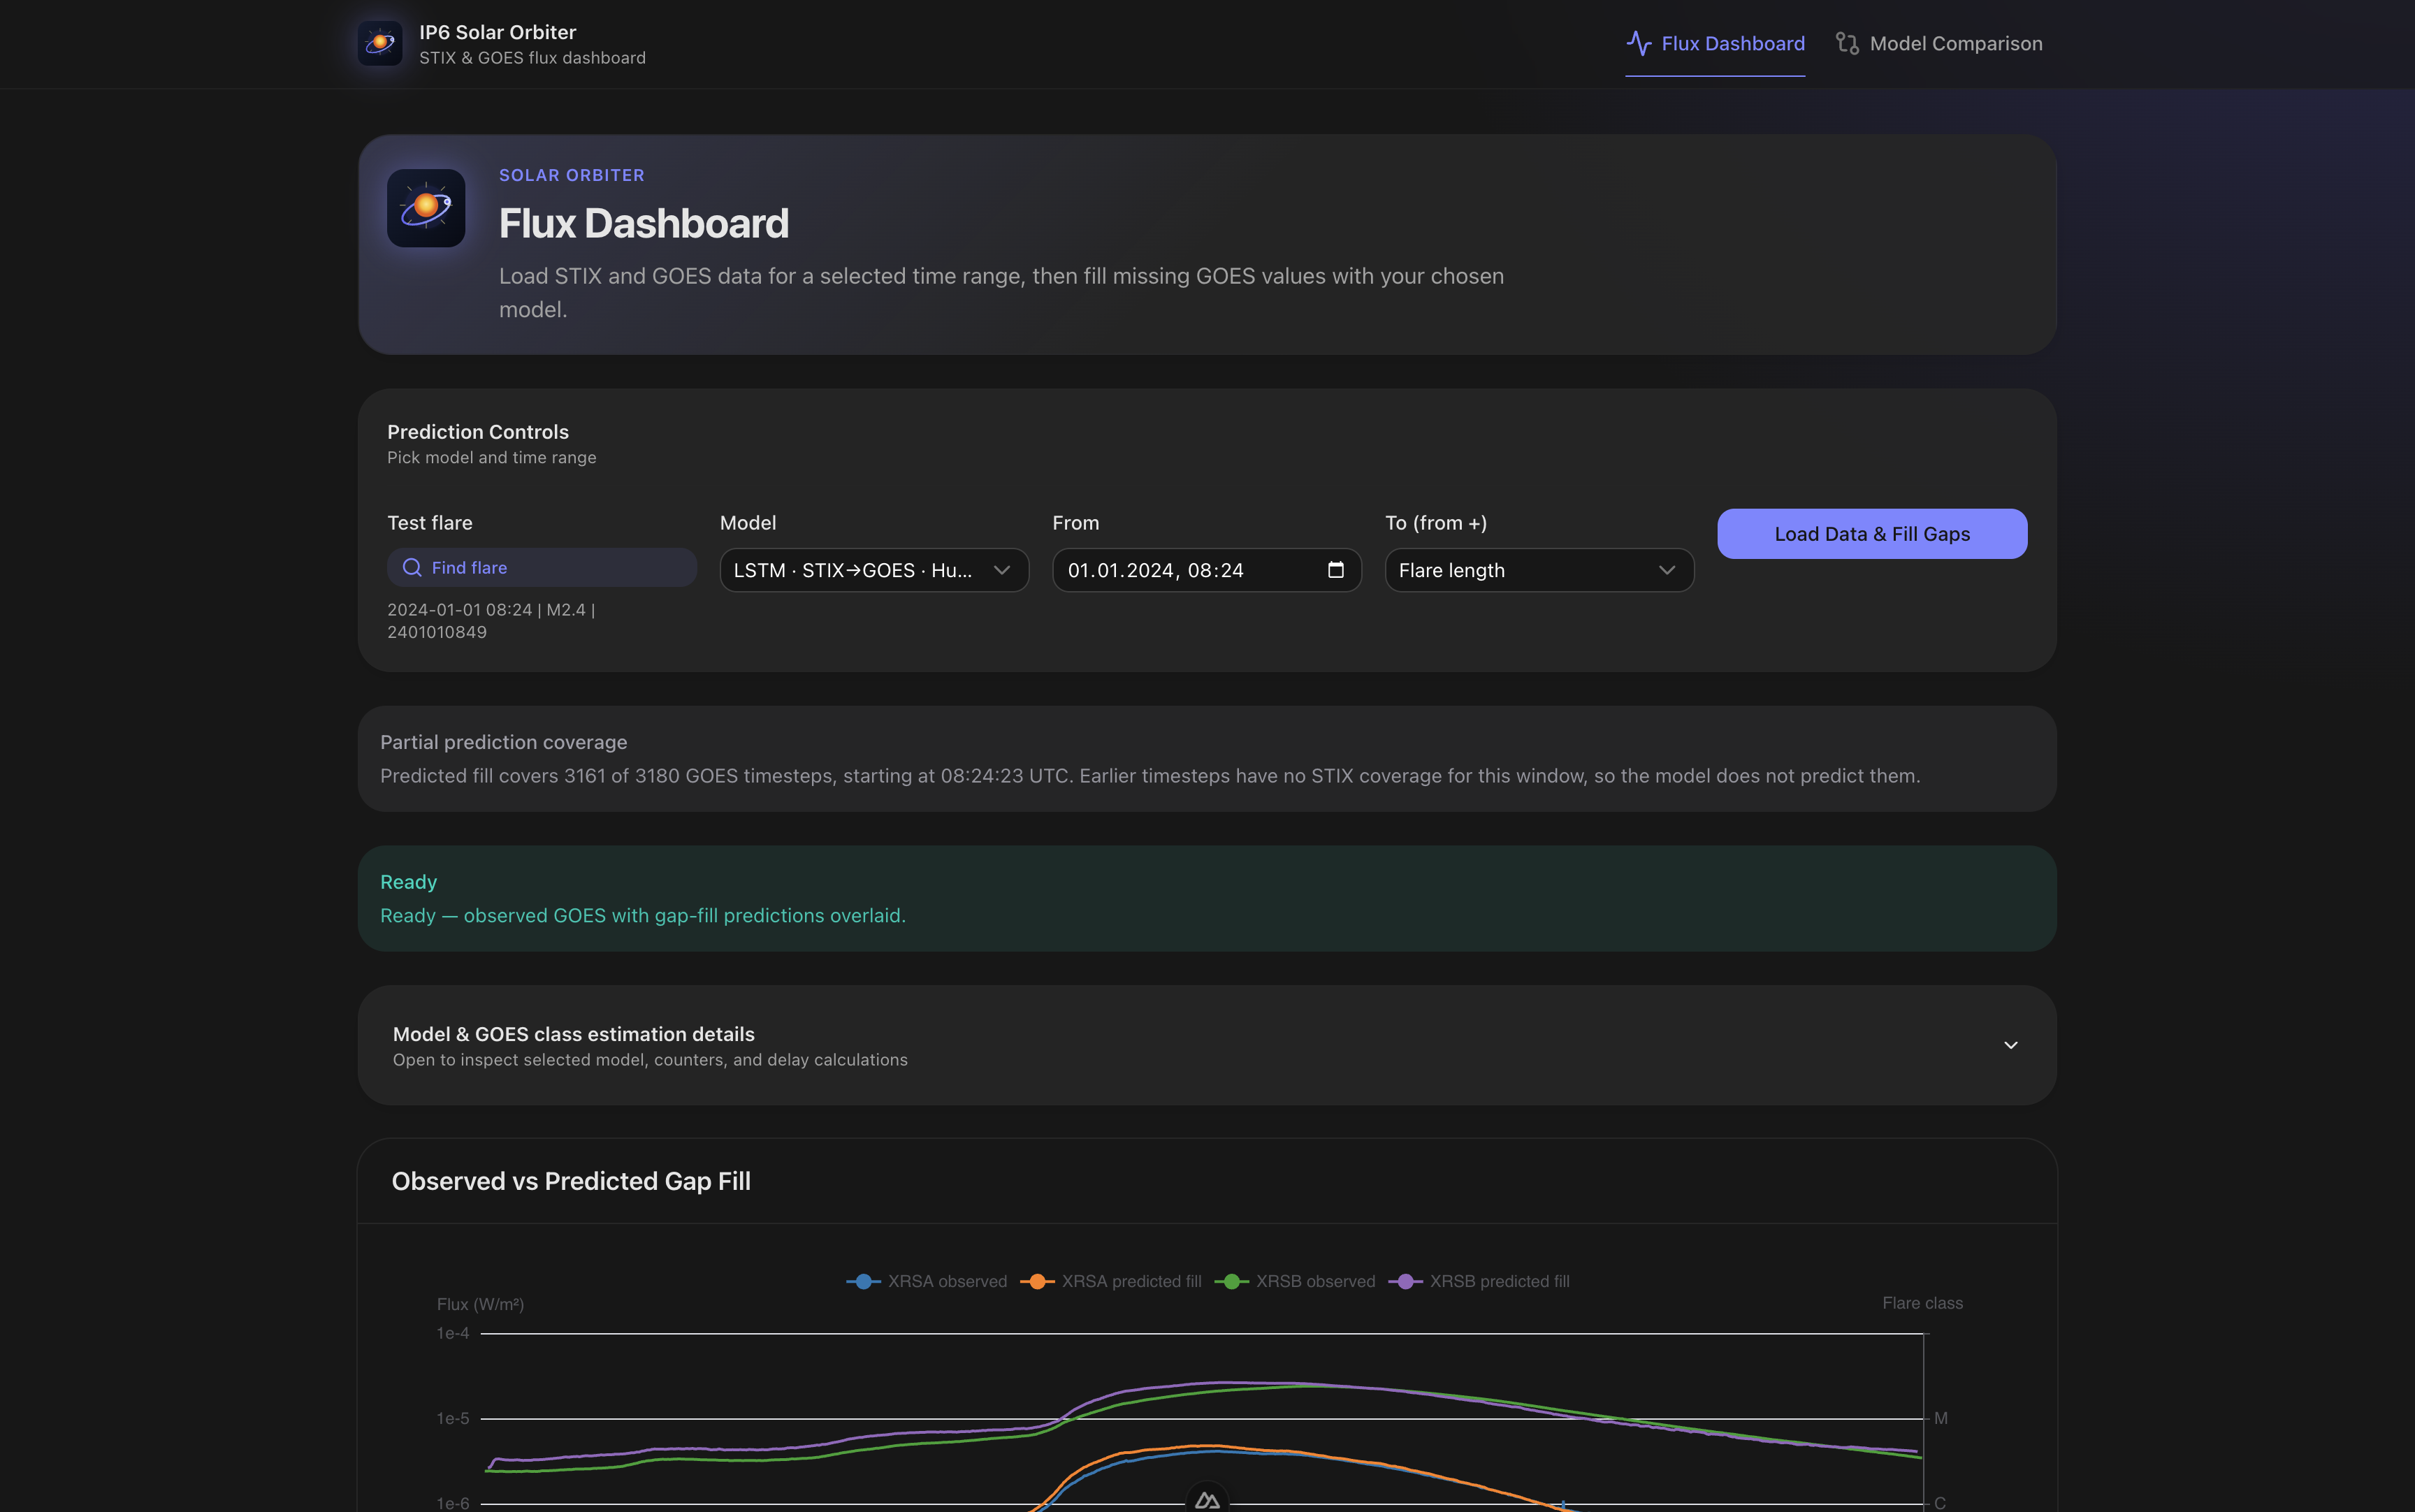
A clean dashboard lets visitors pick a time window and see how strong a flare would look on the familiar Earth-based scale — without installing research software.
Compare approaches
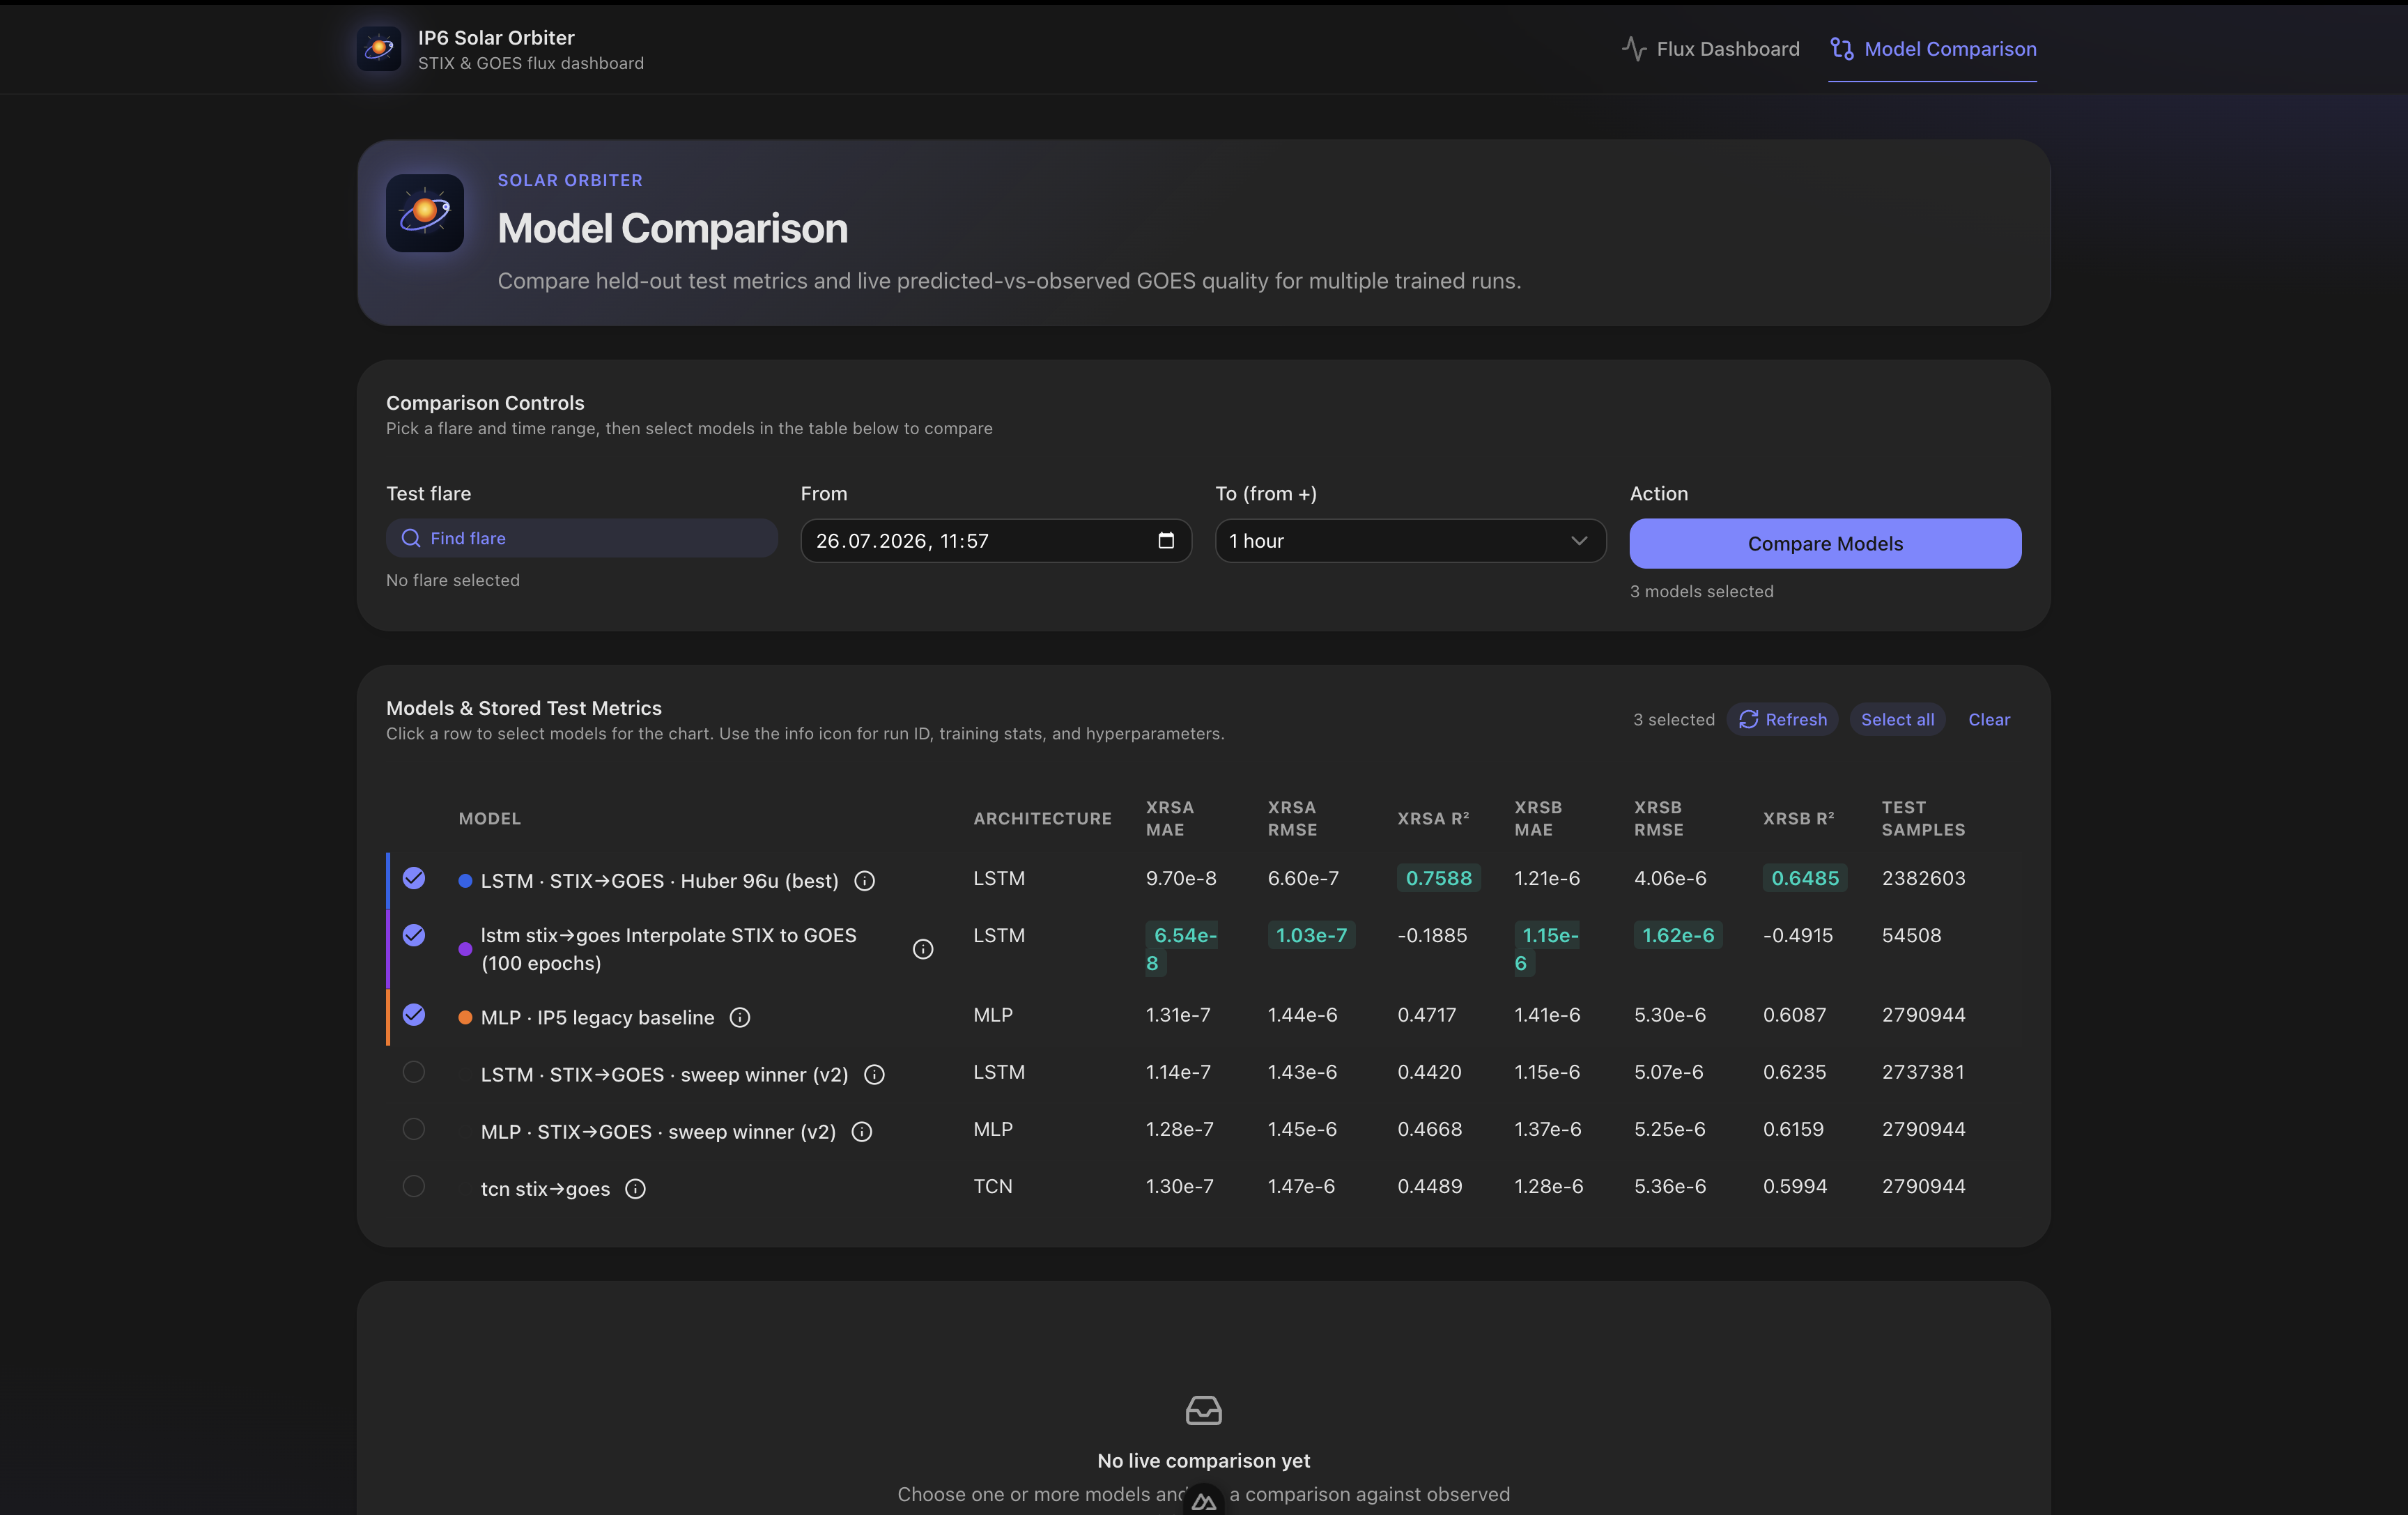
We do not rely on a single idea. Different prediction methods can be compared on the same event, so strengths and weaknesses stay visible.
See a real example
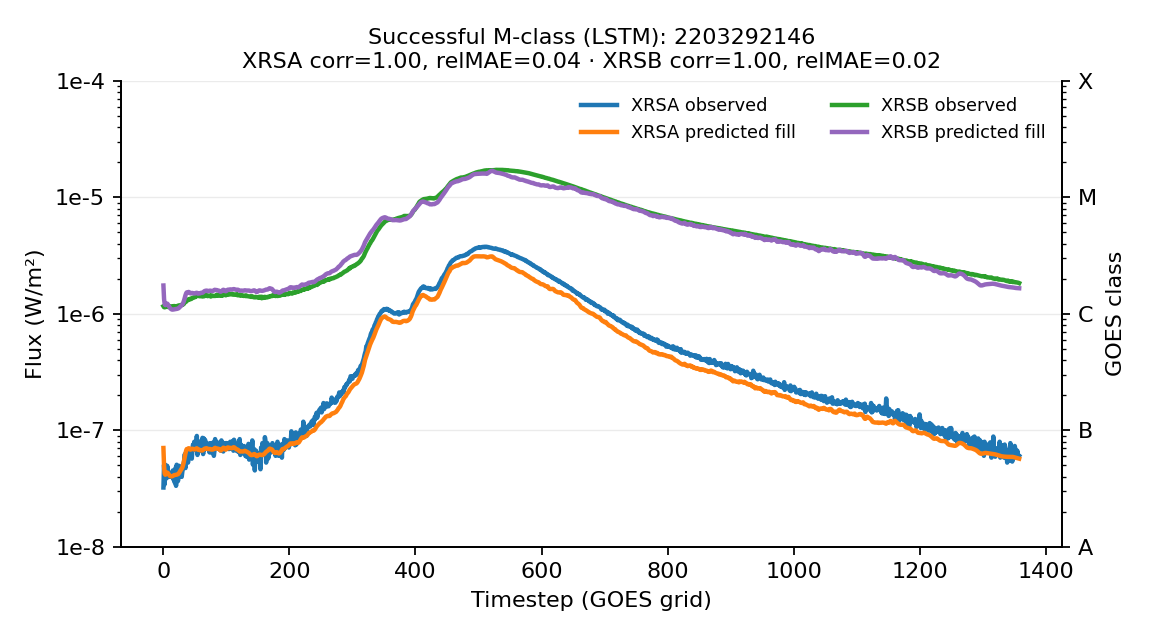
Charts show the measured Earth-side curve next to our estimate — so experts and non-experts can judge quality by eye.
Solution developed and its benefits
Think of the project as a careful assembly line. First we find flares that both instruments saw at the same time and align their timelines fairly (distance and light-travel effects matter when spacecraft are far apart). Then we clean and organise that training material so experiments can be repeated — important for science and for future students. Next we train several computer models that learn the relationship between STIX signals and GOES curves. Finally we publish the best results behind a simple web interface and an API, hosted for demonstration on Azure.
What does that mean for a project partner or visitor from industry?
- A shared language for hidden flares — far-side events can be discussed with the same strength scale used in everyday space-weather practice.
- A product you can open, not only a thesis — try the live demo: web application (API: service endpoint).
- Honest quality checks — we evaluate on flares the models never trained on, so numbers reflect real generalisation, not memorisation.
- Several methods compared — classical and modern neural approaches sit side by side; the best reach roughly half the variance explained on a carefully cleaned dataset (about R² 0.55), with clear room — and a roadmap — for further improvement.
- Repeatable data work — the pipeline is versioned so colleagues can rebuild datasets and retrain instead of depending on a single laptop.
- Built for FHNW’s solar community — designed as a step toward use around the STIX Data Center, where researchers already work with Solar Orbiter data.
- Open collaboration — open-access code and documentation so follow-up projects can continue without starting from zero.
In short: FHNW students took a real scientific gap — “we can see the flare, but we cannot express it in the standard scale” — and turned it into software, evaluation, and a public demonstration. That combination of domain challenge, data engineering, machine learning, and usable delivery is exactly what applied bachelor projects at the School of Computer Science aim to show.
Project data: Informatik Projekt 6 (IP6) · 23.02.2026 – 07.08.2026 · team of 2 · 360 h per person (720 h total).
Key terms
- DomainSolar flares, space weather, Solar Orbiter, far-side flare classification (A/B/C/M/X)
- InstrumentsSTIX (4–150 keV), GOES soft X-ray flux (XRSA/XRSB)
- Machine learningMLP, LSTM, TCN, time-series regression, IP5 MLP baseline
- EvaluationR², MAE, flare-level held-out splits, dataset v3 (coverage-correct)
- MLOps / dataDVC, GCS remote, reproducible preprocessing & versioning
- Software stackPython, TensorFlow/Keras, Flask API, Nuxt dashboard, Azure SWA & App Service
- Integration targetSTIX Data Center (FHNW)
Customer
FHNW – School of Computer Science
Institute for Data Science (I4DS) · Astroinformatics and Heliophysics
Bahnhofstrasse 6
CH-5210 Windisch
STIX Data Center
fhnw.ch – Computer Science
Interested in proposing a similar challenge for a student team? FHNW welcomes project ideas from industry and research partners.
Team
Alain Nicolas Burger
alain.burger@students.fhnw.ch
Timon van den Nobelen
timon.vandennobelen@students.fhnw.ch
Supervisors
Dr. Paolo Massa
Prof. Dr. Samuel Krucker
Expert
Patrick Giedemann