
Machine Learning for Health Profile Discovery in Large Data from Senior Homes
Understanding how health evolves in elderly nursing home residents is essential for improving care and outcomes. Aging is not a single, uniform process, but a complex and highly individual journey shaped by physical, cognitive, and psychosocial changes. The Resident Assessment Instrument (RAI) routinely captures these dimensions across nursing home residents, generating a rich but largely underexplored source of (longitudinal) data.
Initial situation
Understanding the health trajectories of elderly nursing home residents is essential for improving long-term care and outcomes. The Swiss Resident Assessment Instrument (RAI) dataset contains detailed information on over 150,000 residents and 1.6 million assessments across physical, cognitive, and psychosocial domains. However, its high dimensionality and largely categorical structure make it difficult to analyze using traditional statistical methods. These approaches often rely on predefined assumptions and struggle to capture complex, nonlinear interactions between health factors. As a result, identifying hidden patterns, resident subgroups, or risk profiles remains challenging. Modern machine learning methods offer new opportunities to better explore and understand this rich dataset.
Problem statement / Project goal
This project aims to make the Swiss RAI dataset more accessible and insightful for researchers and healthcare professionals. By developing an unsupervised machine learning pipeline, it seeks to automatically identify meaningful resident profiles and hidden health patterns. Techniques such as clustering and deep learning will be used to uncover groups with similar trajectories, risks, or care needs. A strong focus is placed on explainability, ensuring that results are interpretable and clinically relevant through visualization and explainable AI methods. The project also aims to bridge the gap between data science and medical practice. Ultimately, it supports better decision-making, improved care planning, and a deeper understanding of geriatric health.
Understanding High-Dimensional Data
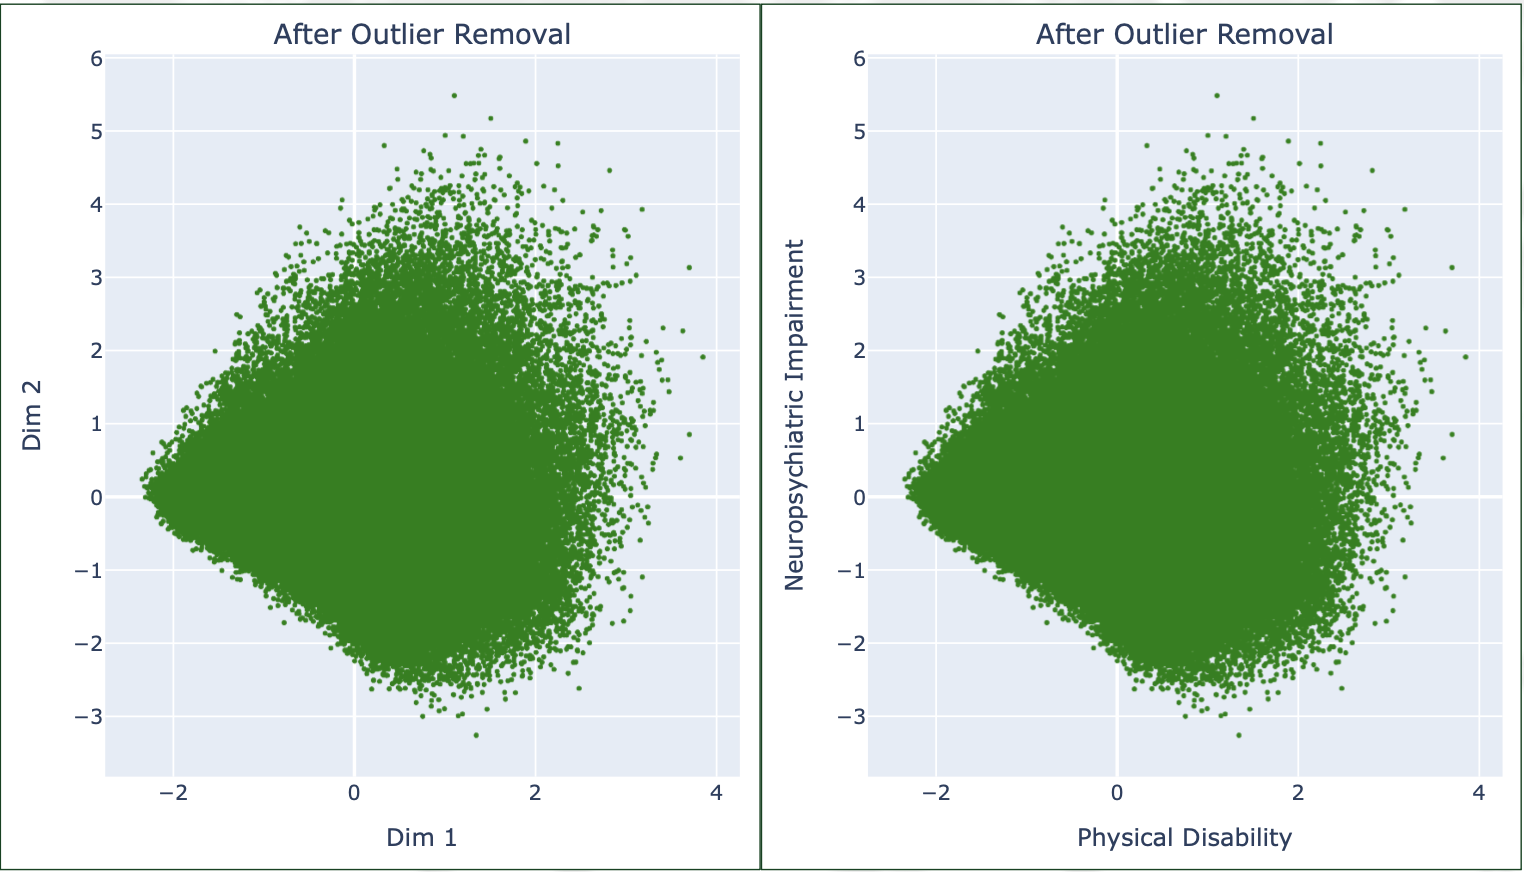
Transforming the high-dimensional RAI data into a lower-dimensional, interpretable space using dimensionality reduction. This makes complex patterns easier to visualize and understand. This step builds the foundation for meaningful analysis and insights.
Clustering
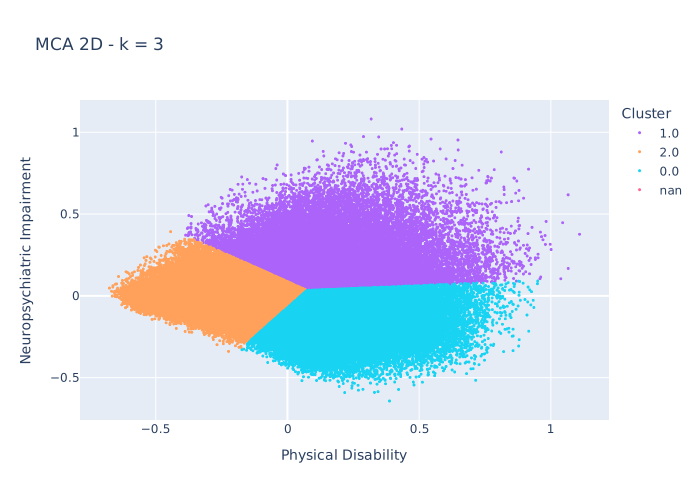
Applying unsupervised machine learning methods to group residents with similar characteristics and health trajectories. Different clustering approaches are explored to capture diverse patterns within the data. This helps uncover hidden structures that are not visible through traditional analysis.
Analyzing Clusters
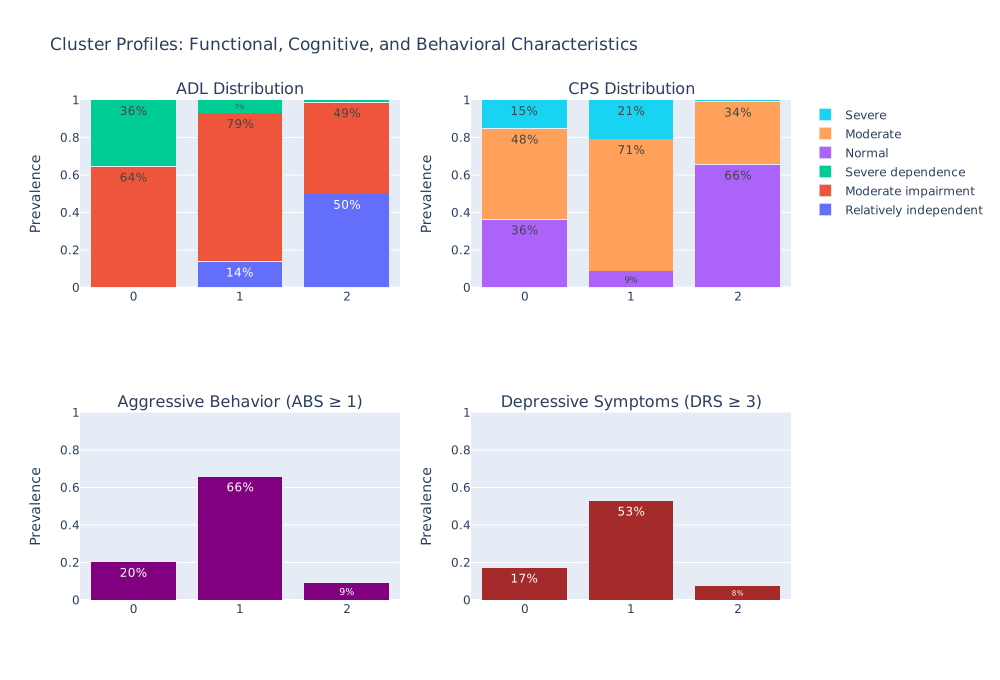
Analyzing and explaining the identified groups to understand their clinical meaning. Key features and differences between clusters are examined to make results interpretable. The goal is to translate patterns into actionable insights for research and care.
Solution developed and its benefits
We developed a Python notebook that guides medical users through the entire analysis workflow from start to finish. The notebook is fully parameterized, so users only need to set a few options to run the complete pipeline, making complex data analysis accessible without programming expertise.
- A guided, step-by-step approach through the notebook
- Interactive plots for better understanding and exploration of data
- Exportable graphs and plots for reporting and presentations
- Clear explanations of the steps performed in each part of the workflow
This solution simplifies the exploration of complex health data, making previously hidden patterns interpretable. It empowers clinicians and researchers to gain actionable insights efficiently, while maintaining transparency and reproducibility at every step.
Key terms
- Guided WorkflowThe notebook leads users step by step through the analysis, making complex processes easy to follow.
- Clustering Insights Residents with similar health patterns are grouped together to reveal hidden subpopulations and trends.
- Unsupervised Machine Learning MethodsAdvanced algorithms uncover patterns in the data that are difficult to detect with traditional data analysis.
- Interactive PlotsUsers can explore results dynamically to better understand relationships and trends.
- Actionable InsightsThe results provide practical takeaways to support care planning and decision-making.
Customers

Universität Zürich
MD. Florian Riese
Dr. Ania Mikos
8006 Zürich
Website

Klinik Barmelweid
PD Dr. med. Mathias Schlögl
5017 Barmelweid
Website
Team
Denis Kai Wilhelm
Advisor
Prof. Dr. Arzu Cöltekin
Cédric Merz
Rahel Ganarin