
Can we really predict how a brain tumor will grow? An eye tracking study
This thesis investigates how medical experts and AI professionals visually perceive and classify real versus DDIM-generated brain MRI scans of diffuse midline gliomas (DMGs) using eye-tracking experiments. By analyzing visual attention patterns, the study explores the potential of generative AI models in medical imaging and lays the groundwork for future research on their validation in clinical settings.
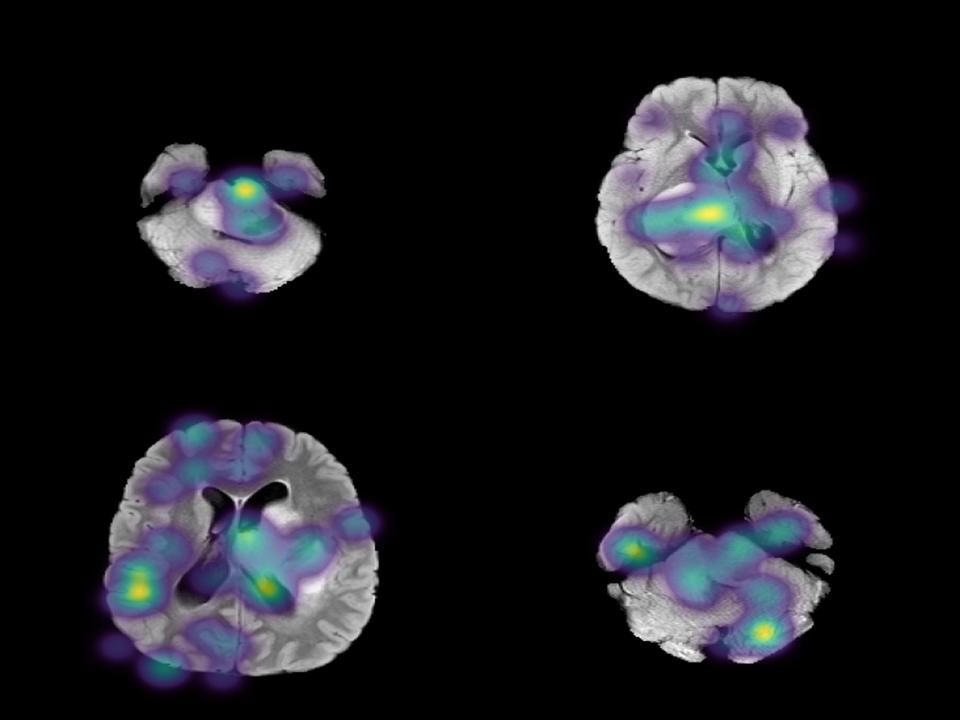
This image shows the focus points of participants on different MRI scans.
Initial situation
The Department of Radiation Oncology at Inselspital, through the Center for Artificial Intelligence in Radiation Oncology (CAIRO), developed a generative AI model (DDIM) to reconstruct MRI scans of diffuse midline gliomas (DMGs), an aggressive brain tumor. This model can generate anatomically plausible MRI scans and manipulate tumor sizes. While traditional computational metrics such as FID and SSIM suggest high image quality, these metrics often fail to align with human expert perception. A pilot study conducted by CAIRO found that radiologists struggled to distinguish real from DDIM-generated scans, achieving only 51% accuracy, suggesting that the generated images appear plausible to the human eye despite subtle differences detectable by machine learning models.
Project goal
This project aims to expand on CAIRO's pilot study by conducting eye-tracking experiments to collect a more extensive dataset. By analyzing visual attention patterns, the study seeks to better understand how medical professionals and AI experts perceive and classify real versus generated DMG MRI scans, addressing the gaps in traditional computational image quality metrics. The findings will contribute to the development of more robust methods for evaluating generative medical imaging models.
Experiment Setup
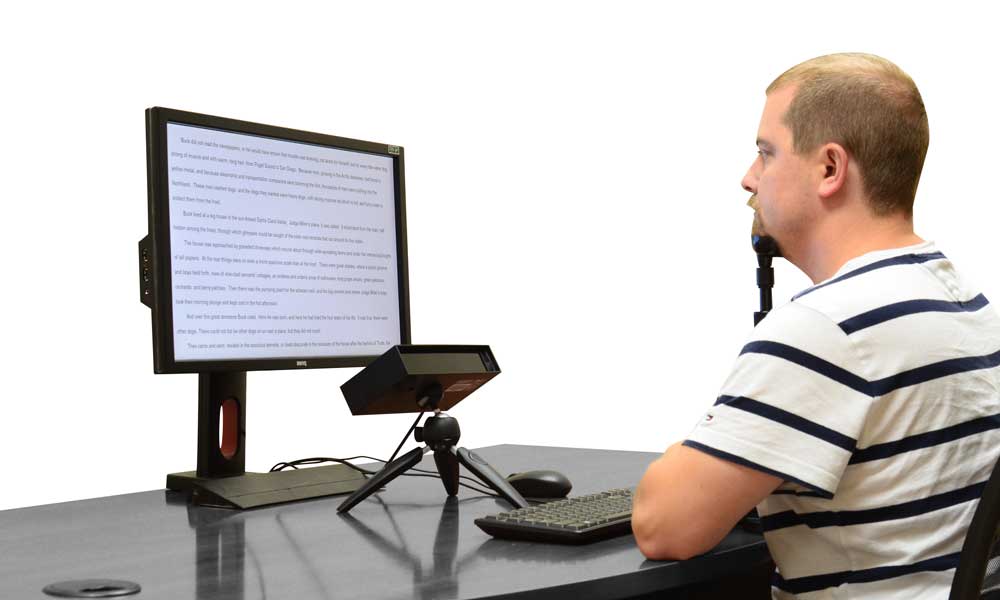
Setup with the EyeLink Portable Duo eye-tracker.
The experiment setup used the EyeLink Portable Duo eye-tracker in remote mode, with participants wearing a calibration sticker and resting their chin on a head support to ensure stable gaze tracking. Visual stimuli were displayed on a Full HD monitor, and the experiment, consisting of two classification tasks, was controlled by specialized software that alsp recorded precise eye movement data.
Task 1 - Single Image Classification
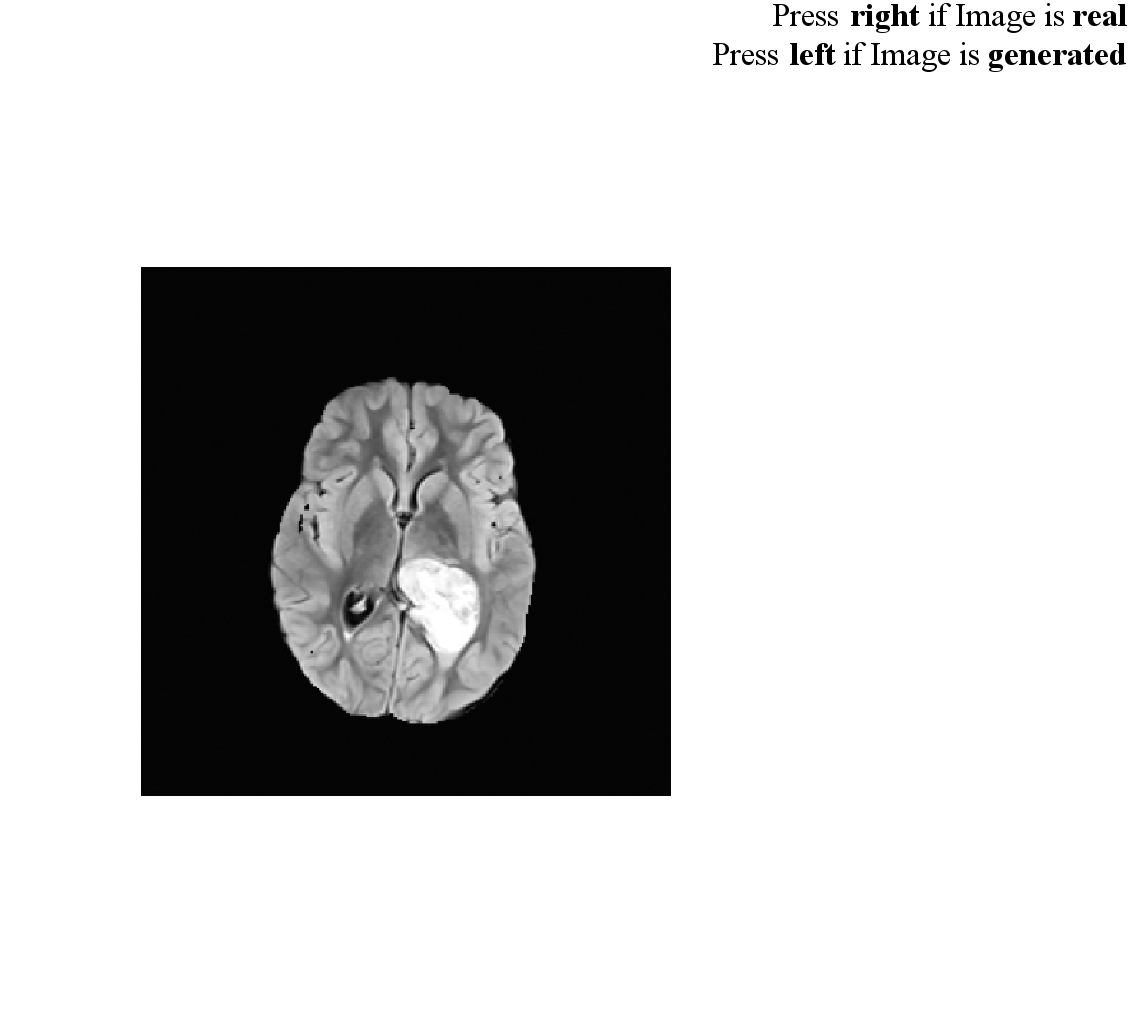
Example screen from Task 1 of the experiment.
In this challenge, participants faced a simple yet surprisingly tricky question: Is this brain MRI scan real or AI-generated? Each image appeared on the screen for up to 45 seconds, and participants made their choice with a quick tap of the arrow keys, right for real, left for generated. Before the task began, a short training video, precise eye-tracker calibration, and a quick practice round ensured everyone was ready. As they made their decisions, every eye movement was recorded, revealing exactly where their attention went while making the decision.
Task 2 - Image Pair Comparison
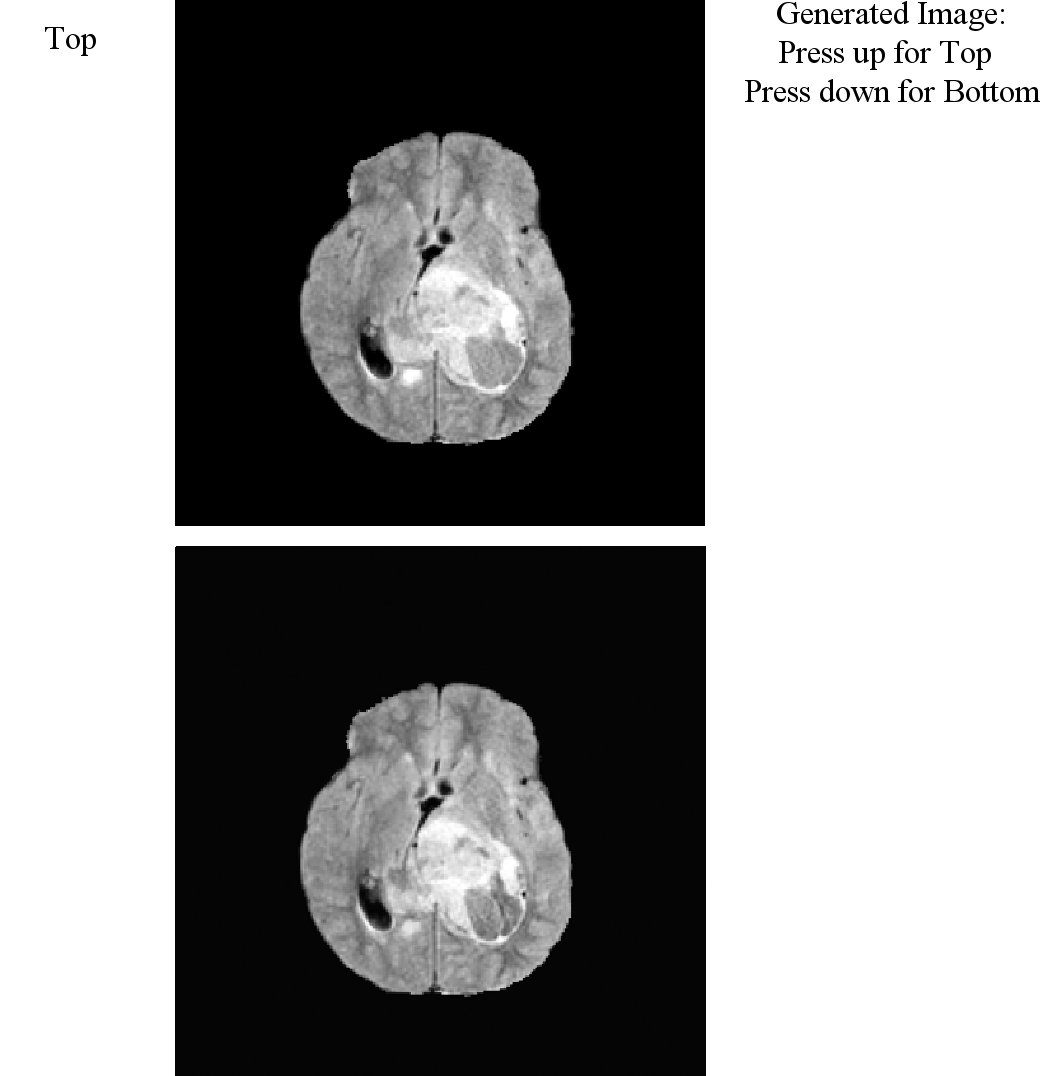
Example screen from Task 2 of the experiment.
In the second task, participants were presented with two MRI scans simultaneously, one real and one AI-generated version of the same original image, and were asked to identify the generated image. An up-arrow key indicated that the top image was AI-generated, while a down-arrow key indicated the bottom image. After each decision, participants rated their confidence, providing an additional measure for analysis. Prior to the task, a training video introduced subtle visual cues often found in generated images, and a calibration procedure ensured precise eye-tracking data. Each image pair was shown in a randomized order, with a 40-second response window per trial.
From Gaze to Insight
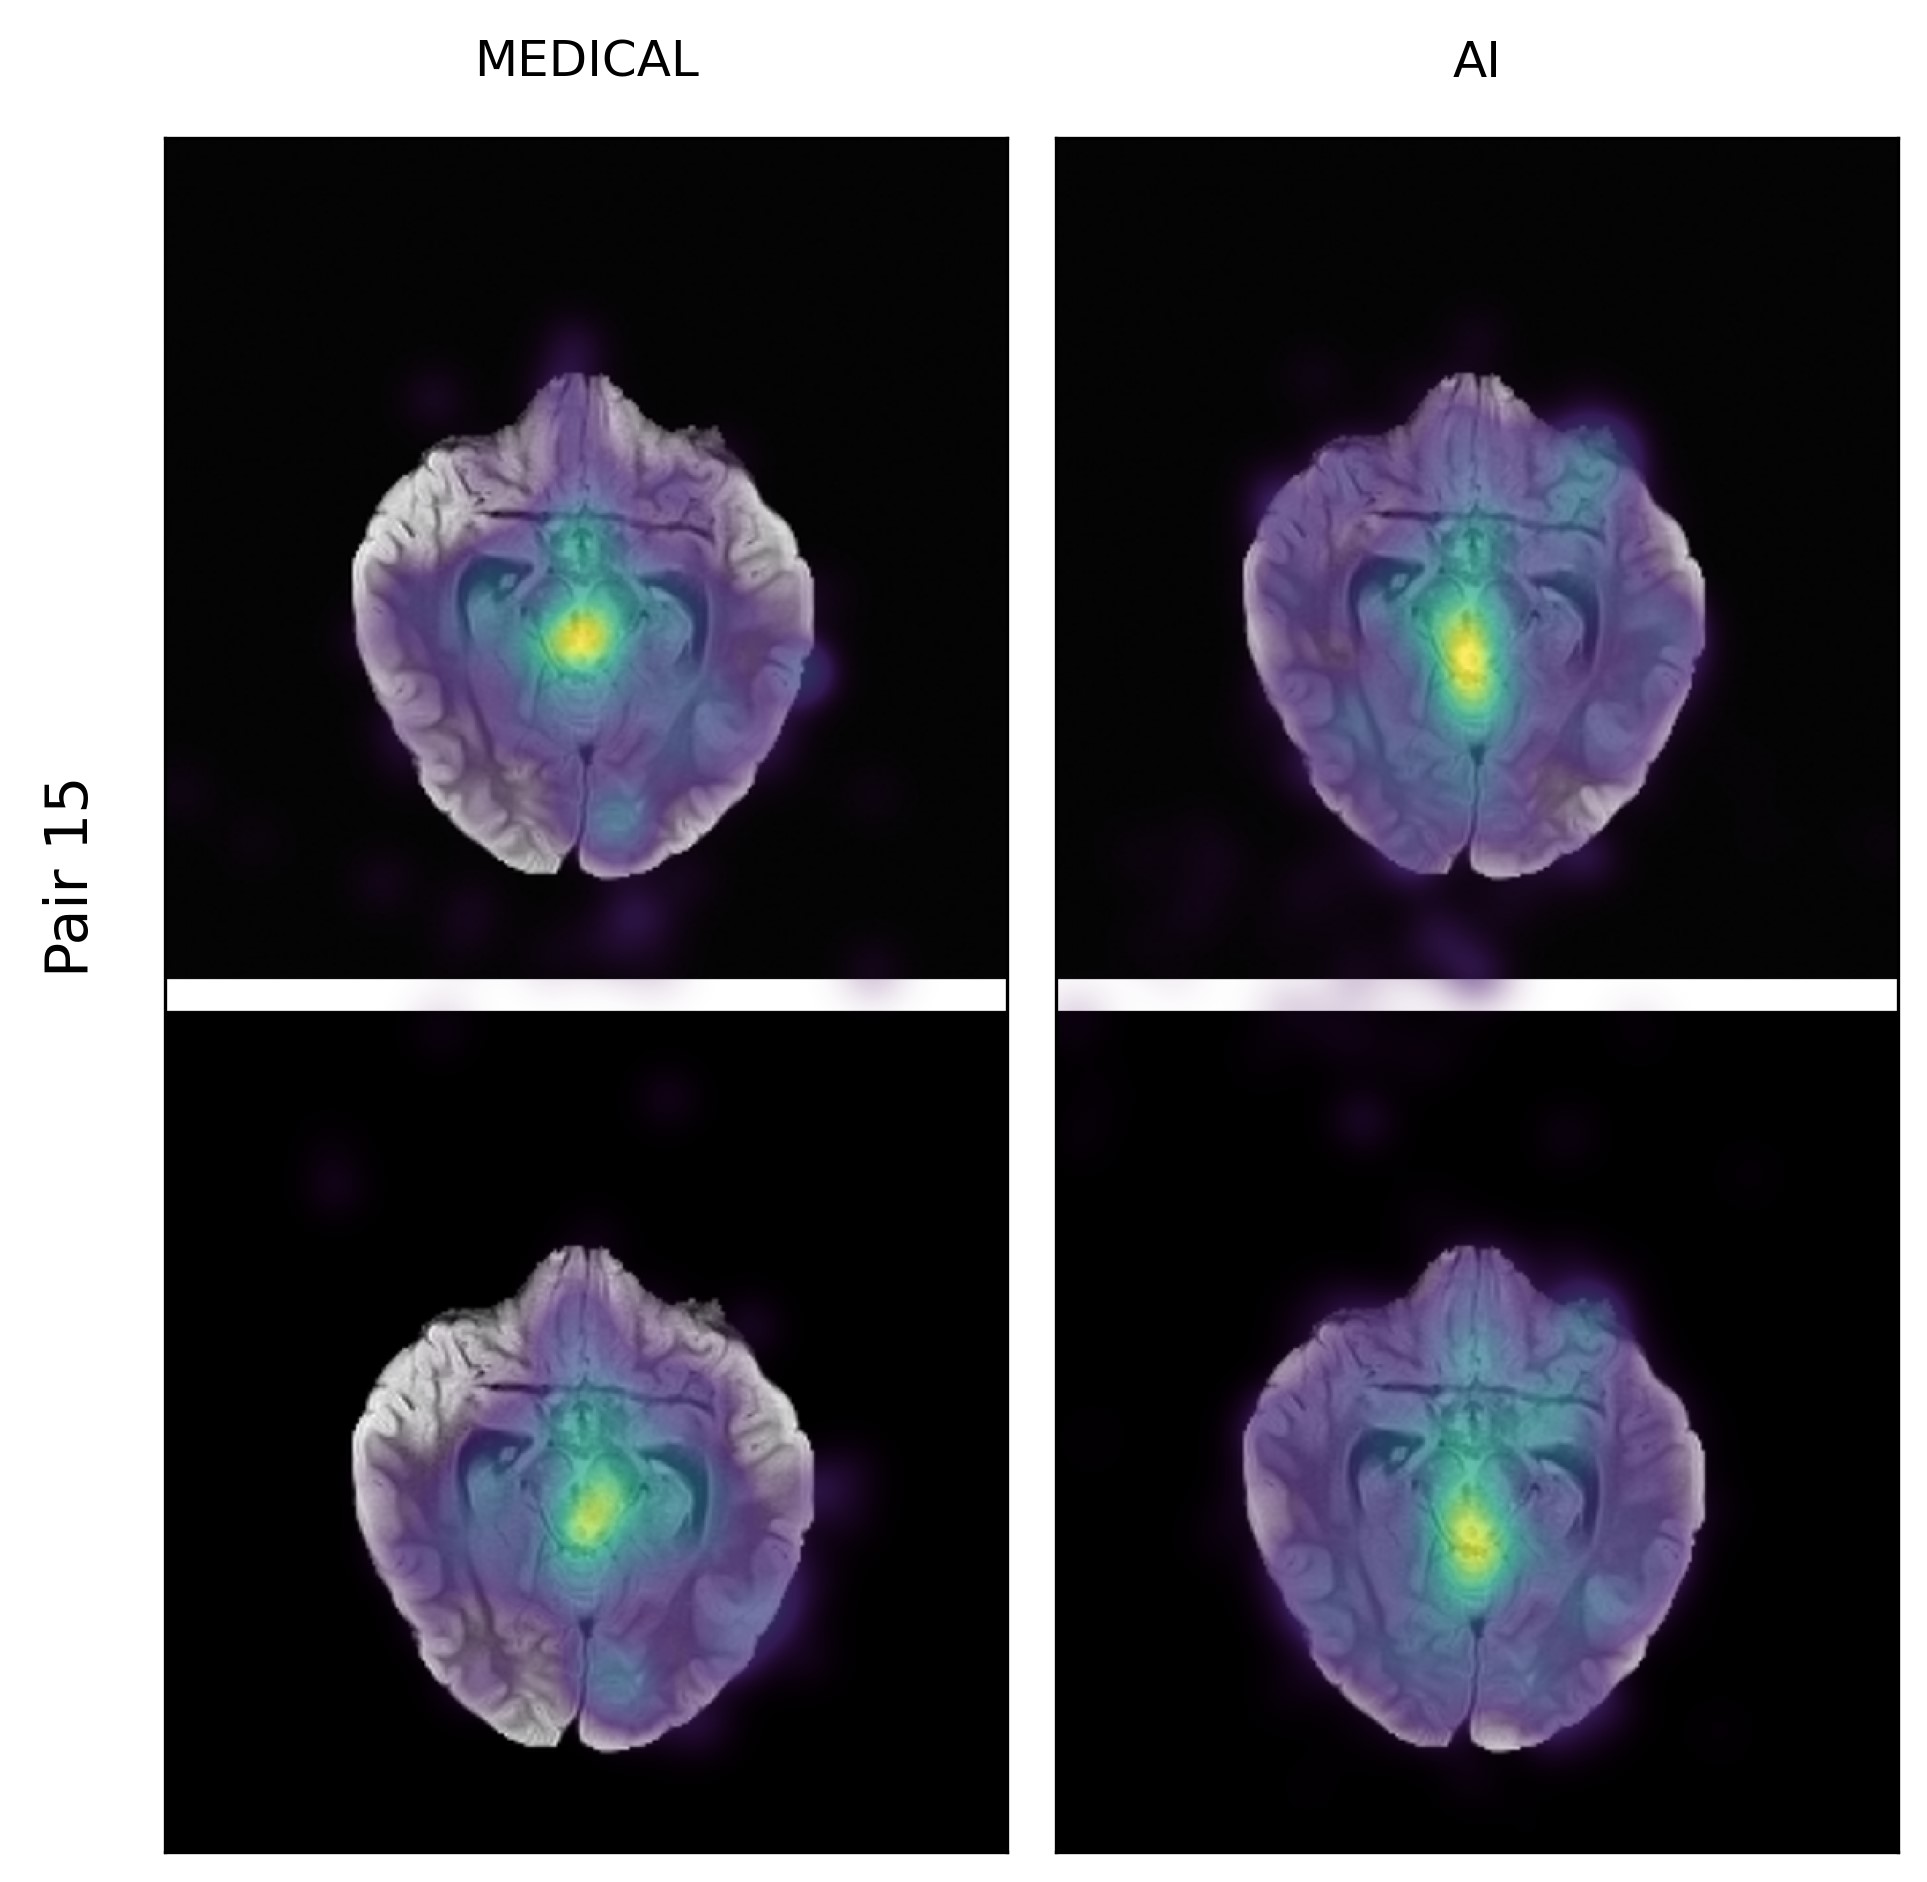
Attention patterns visualized as heatmaps for the Medical and AI groups separately
The experiment generated a comprehensive dataset combining participant decisions, confidence ratings, and detailed eye-tracking measurements. Raw gaze data was processed and transformed into meaningful metrics, enabling quantitative analysis of visual attention patterns. Additionally, the eye-tracking data was overlaid onto the original MRI scans as heatmaps, providing a clear visual representation of where participants focused their attention. These heatmaps offer valuable insights into how different groups perceive and evaluate medical imagery.
Solution developed and its benefits
We developed a comprehensive experimental framework to study how medical experts and AI professionals perceive real versus AI-generated MRI scans of diffuse midline gliomas (DMGs). This system combined a two-task experimental design with precise eye-tracking, implemented in SR Research Experiment Builder, and deployed in multiple locations. Unlike the earlier CAIRO pilot—limited to a single decision-making task without eye-tracking, timing measurements, or participant training—our setup introduced structured onboarding, real-time gaze tracking, and controlled presentation of both single images and paired comparisons.
- Two-Task Experimental Design:
- Single Image Classification – participants judged whether a single MRI scan was real or AI-generated. (Accuracy: Medical 53% ± 4%, AI 49% ± 6%)
- Image Pair Comparison – participants identified the generated image in a pair containing one real and one AI-generated scan. (Accuracy: Medical 63% ± 16%, AI 57% ± 14%)
- Participant Training & Calibration: Training videos introduced MRI characteristics and common generative artifacts, while calibration and validation ensured precise gaze tracking before each task.
- Eye-Tracking Data Capture: Used the EyeLink Portable Duo in remote mode with chin rest and forehead calibration sticker, recording at 1000 Hz for high temporal resolution.
- Data Processing Pipeline: A custom set of Jupyter notebooks transformed SR Research DataViewer reports into statistical metrics, visual outputs, and heatmaps.
- Heatmap Visualization: Eye-tracking data was overlaid on original MRI scans to directly compare attention patterns between real and generated images.
- Statistical Analysis: Applied advanced attention metrics:
- KL-Divergence: Quantifies the difference between two attention distributions.
- K-Coefficient: Measures the similarity of fixation patterns between participants or groups.
- Correlation Coefficient: Assesses the linear relationship between attention maps, indicating how similarly participants focused on specific image regions.
Benefits of this approach:
- Bridges the gap between computational image quality metrics (e.g., FID, SSIM) and human expert perception.
- Provides a reusable and adaptable framework for perceptual validation of generative medical imaging models.
- Demonstrates that high-quality generated images can be used for training without obvious recognition bias, supporting radiology education and AI-assisted tumor detection.
- Creates a foundation for large-scale studies on perceptual and cognitive factors in medical image interpretation.
Participant Feedback
«The experiment was really interesting, challenging, and fun. I really enjoyed it!»
Participant #22
Key terms
- Eye-TrackingRecording and analyzing gaze positions over time
- Experiment DesignStructured planning of studies for valid results
- Data AnalysisJupyter Notebooks, SR Research DataViewer
- Statistical AnalysisKL-Divergence, K-Coefficient, Correlation Coefficient
- VisualizationHeatmaps, Attention Maps
Customer
Inselspital Bern - Universitätsklinik für Radio- Onkologie
Prof. Dr. Sarah Brüningk
Team
Ognjen Colovic
Alexander Shanmugam
Advisor
Prof. Dr. Arzu Cöltekin
Dr. Laura Fontanesi
Dr. Vagia Tsiminaki