
An exploration of a pediatric brain tumor atlas
Making pediatric tumor data accessible
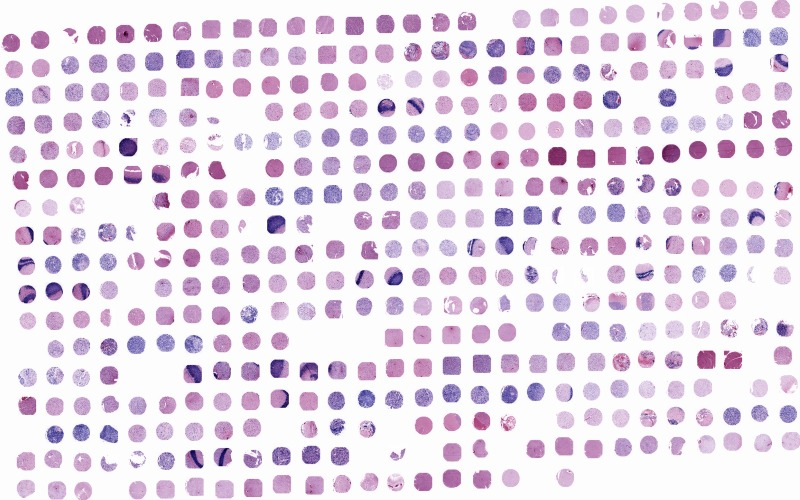
Tissue samples from pediatric brain tumor atlas
Initial situation
Pediatric brain tumors are the leading cause of cancer-related deaths in children. Our clients investigated a particularly hard-to-treat tumor, diffuse midline glioma, which is an aggressive brain tumor that predominantly occurs within the brainstem and is characterized as highly infiltrating. Together with the DMG Center at the University of Zurich and the Kinderspital Zurich, they have collected a worldwide unique number of post-mortem tissue samples from DMG and other pediatric brain tumor patients in a tissue micro array (TMA). This array allows for high-throughput characterization of a total of 918 individual samples from tumors, adjacent healthy brain, and metastatic sites. They used multiplex immunofluorescent staining to obtain a spatial map of proteins within these samples (spatial proteomics) and paired this with standard histopathological stainings, bulk RNA sequencing, and AI Predictions. This unique dataset is was completed and should be made publicly available for exploration and use by others.
Project goal
The goal of this project was to make the pediatric brain tumor dataset accessible to more researchers and clinicians, enabling them to explore the data and gain insights into tumor biology and treatment response. Before this project, accessing and analyzing this valuable dataset was challenging due to its complexity and the sheer size of the data. Due to these constraints the data was only available to a limited group of researchers involved in the original study.
Oncoplot
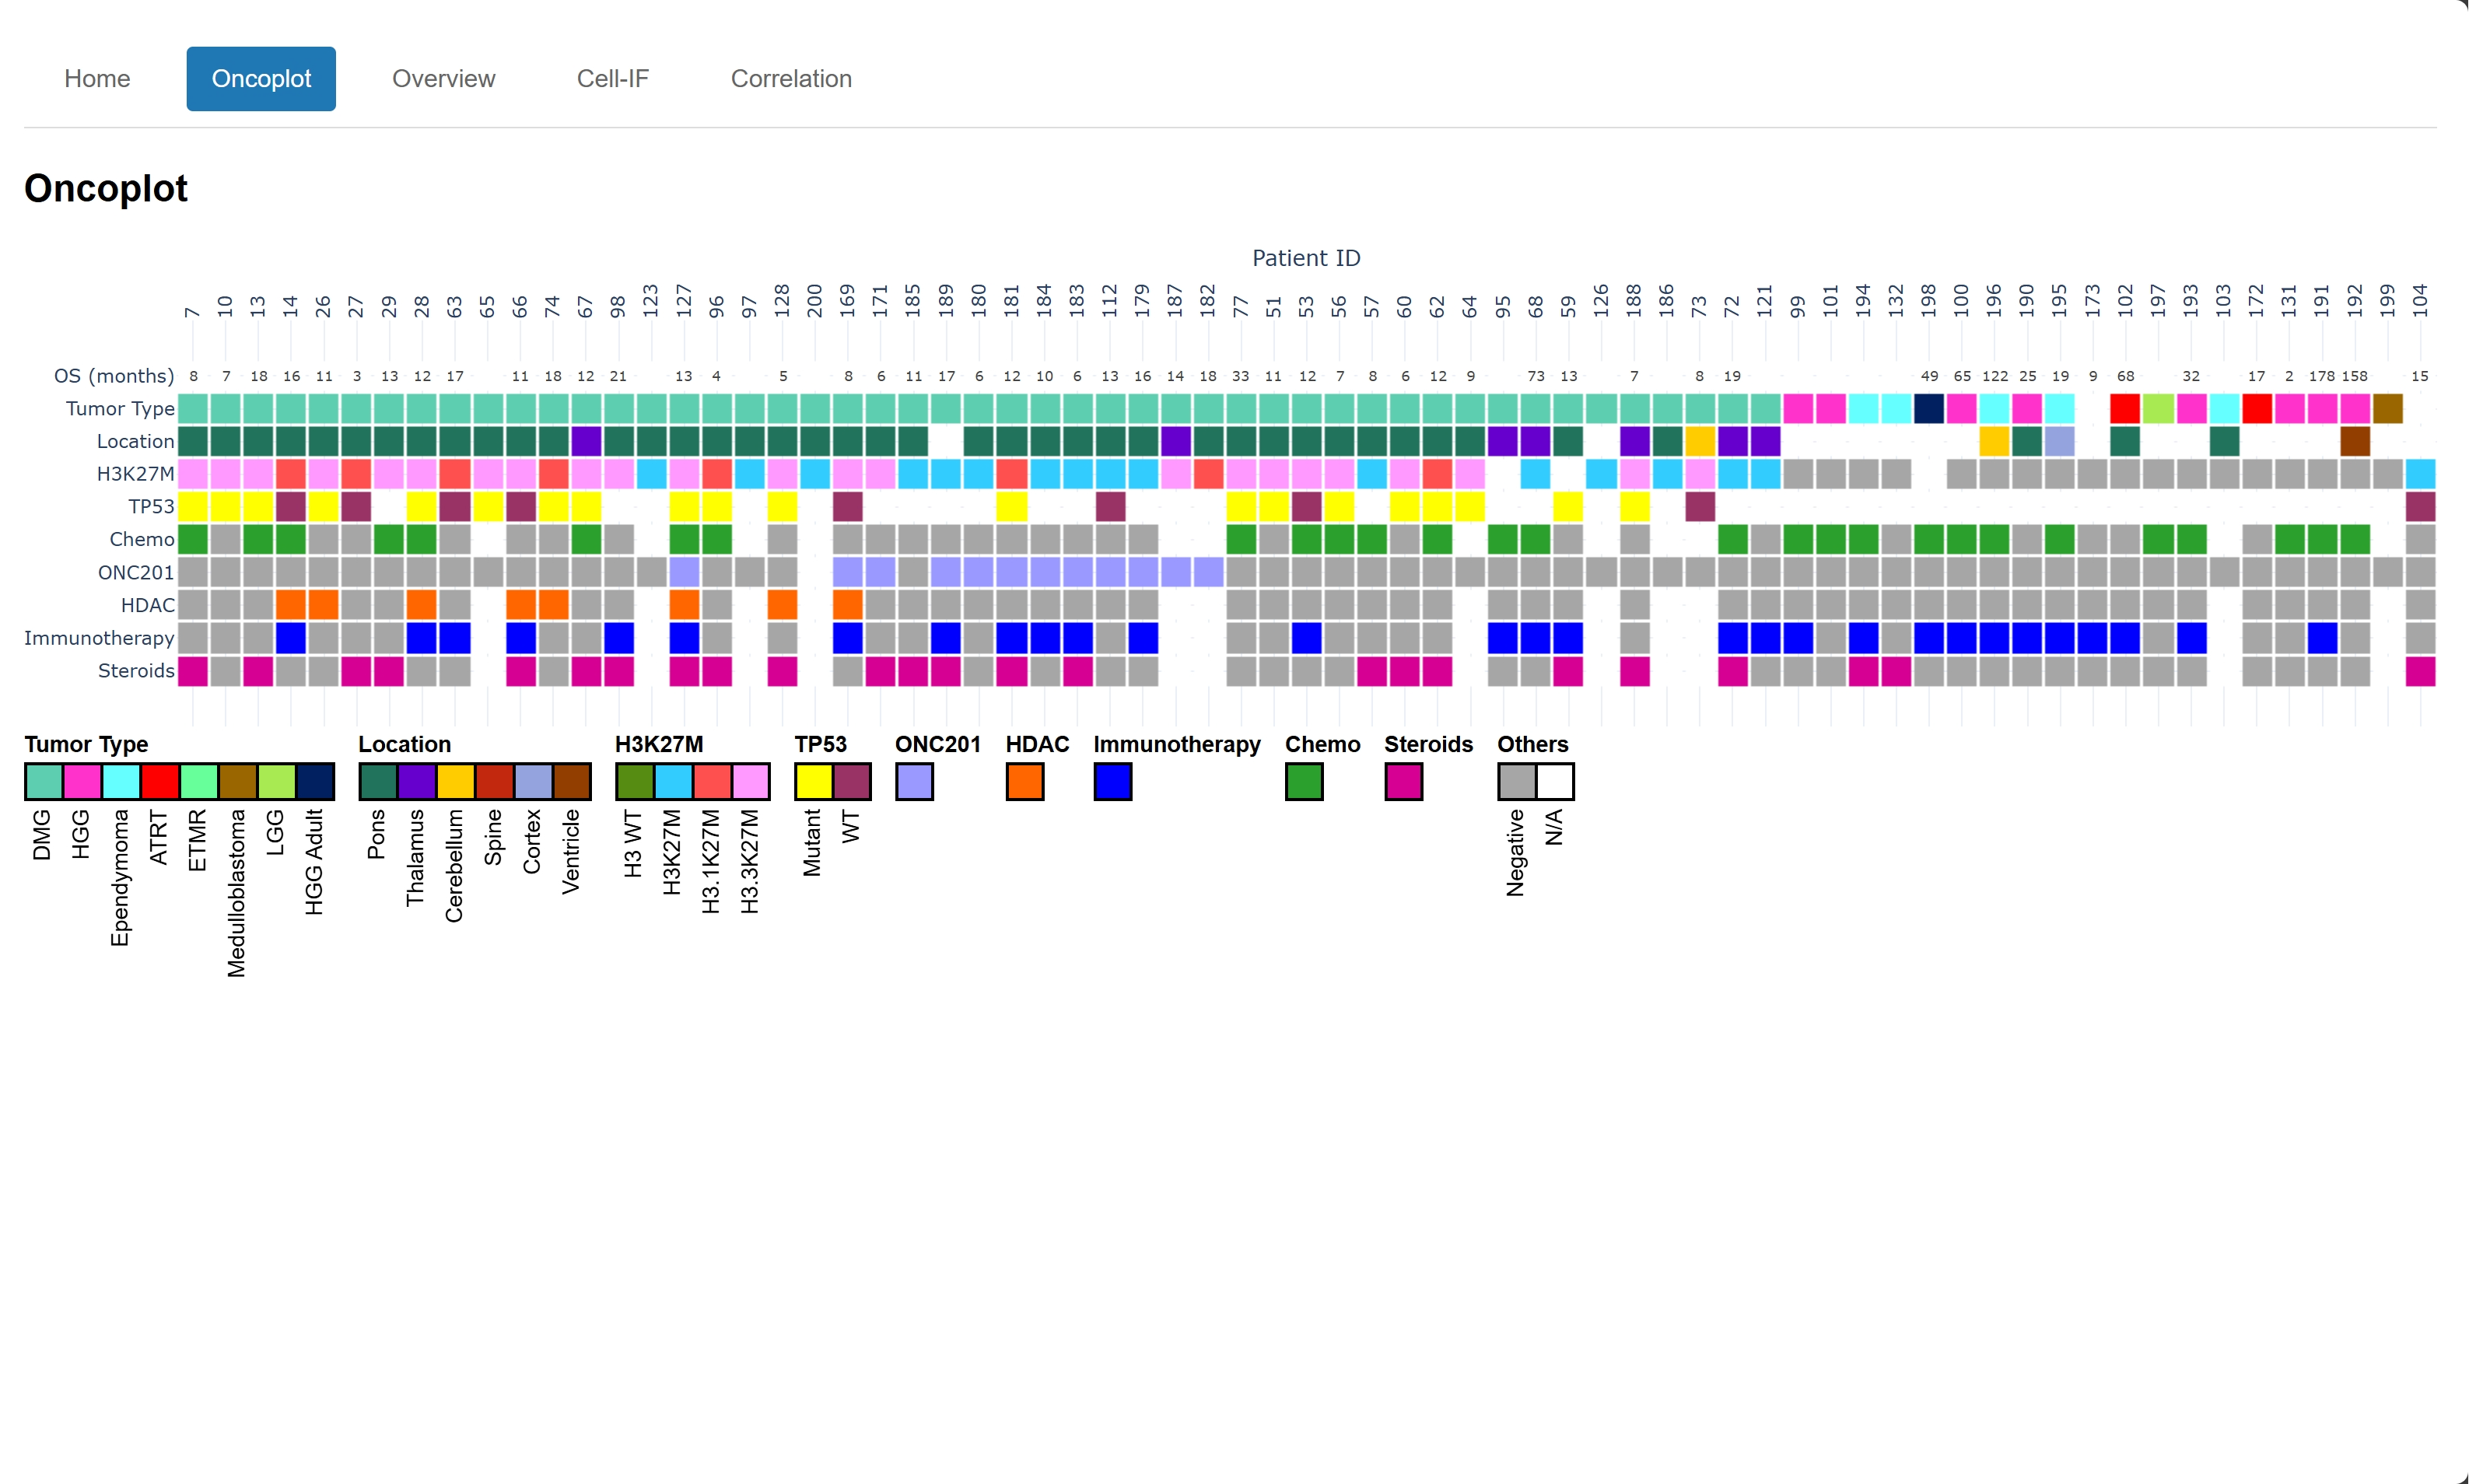
The Oncoplot shows information about patients and their tumors. This includes diagnosis, primary tumor site and treatment information.
Cell-IF
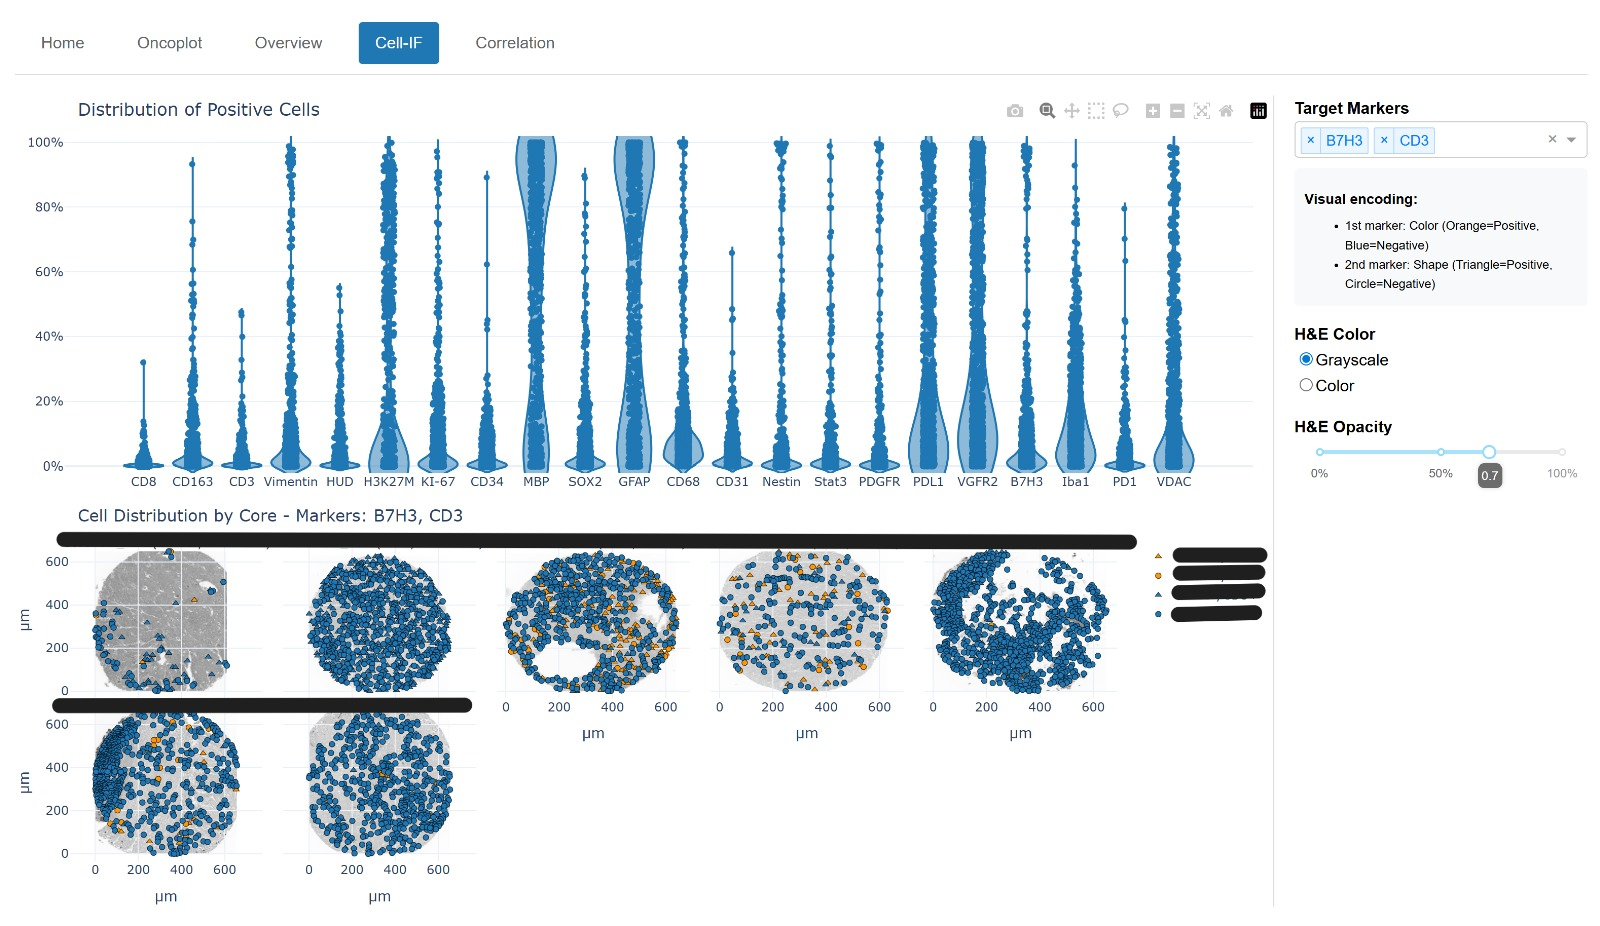
The Cell-IF visualization provides insights into tissue on a cellular level and allows a closer look at the distribution of marker expressions within tissue samples.
Correlation
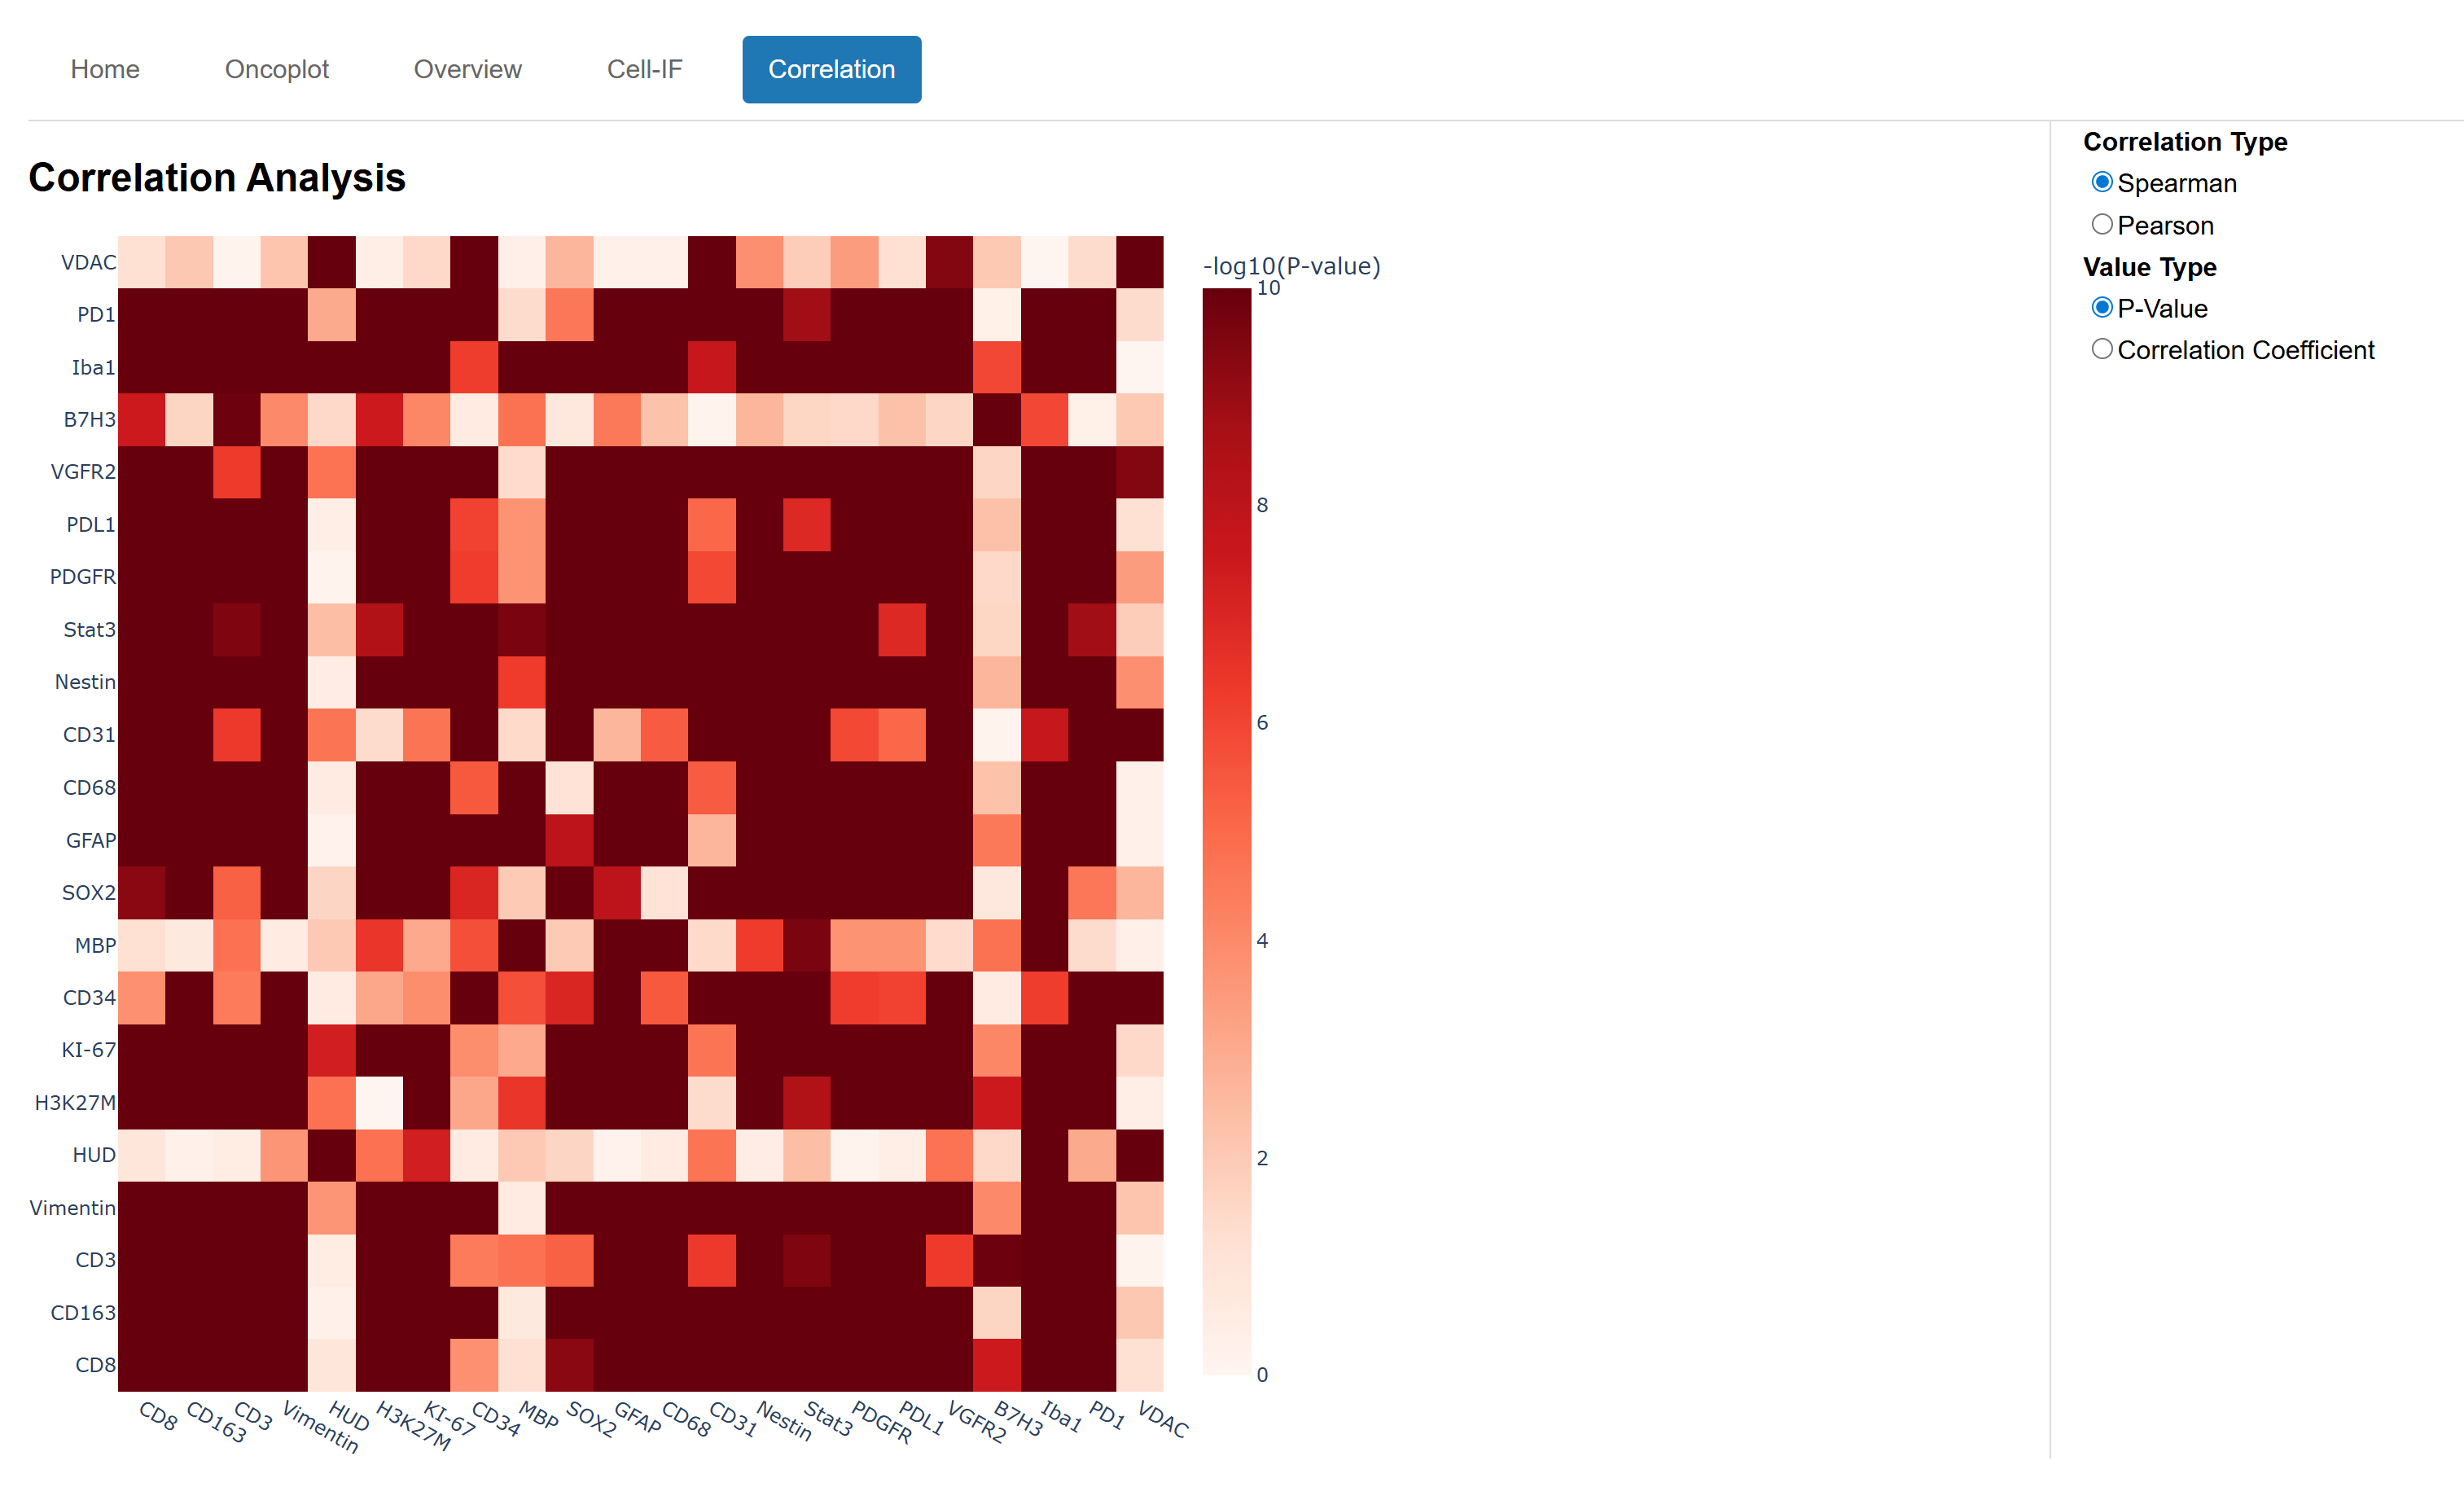
The correlation plot visualizes the relationships between different markers in the dataset, helping to identify potential associations and patterns.
Our solution
The solution developed is a web application that allows users to explore the pediatric brain tumor dataset interactively. The application includes three main components: an Oncoplot, a Cell-IF visualization, and a correlation plot. These components enable users to visualize patient data, cellular information, and marker correlations, respectively. The highlights include of the dashboard include:
- Browser-based access without the need for specialized local software
- Cross-modal filtering and data exploration
- Slim, modular architecture for future extensions
Accessing and exploring complex biomedical datasets often requires specialised software or direct guidance from the original researchers, which can limit the reach of these resources. To address this, we designed, implemented, and evaluated an interactive, hosted dashboard. The dataset-provided by the DMG Center Zurich (Kinderspital Zürich) and a collaborator at the Inselspital Bern includes histopathology images, spatial proteomics, and clinical metadata from 79 pediatric patients.
The platform integrates these modalities in a browser-based interface that supports inspection of individual tissue cores, linked statistical visualizations, flexible cohort filtering, and correlation analysis. It was implemented using Python, Dash, and PostgreSQL, with a modular architecture to facilitate future extensions, and is currently deployed on an institutional server at FHNW.
The development was guided by user-centered design principles, incorporating clear visual encodings, multiple linked views, and an overview-filter-detail interaction flow to balance accessibility with analytical depth. Evaluation with domain experts and technically inclined participants showed that the dashboard can make complex research data more accessible, tangible, and engaging for exploration. In some areas there is still potential for improvement including onboarding of new users.
By lowering barriers to interacting with complex multimodal datasets, this approach can be adapted to other biomedical contexts, fostering more open and collaborative research practices.
Sadly the dashboard is not yet publicly available, but once it is it will be available here.
Key terms
- Plotly/Dash A Python framework for building interactive web applications.
- Overview-filter-detail Interaction model used for data exploration
- Diffuse midline glioma (DMG) An aggressive pediatric brain tumor type targeted in this project
- Spatial proteomics Mapping protein expression patterns within tissue samples
- Histopathology Microscopic examination of stained tissue samples
- Oncoplot Visualization summarizing patient and tumor attributes
Partners

Center of AI in Radiation Oncology
Inselspital, Bern
Website


DMG Center Zurich
Kinderspital, Zürich
Website
Team
Students
Gian Marco Truttmann
Jelle Schutter
Advisors
Arzu Cöltekin
Vagia Tsiminaki