
Vistruct - Health Check Monitoring for Buildings
A modern web platform for structural health monitoring, refurbishing an existing Alpha version for the clients to improve decision-making for asset owners through clear, actionable insights.
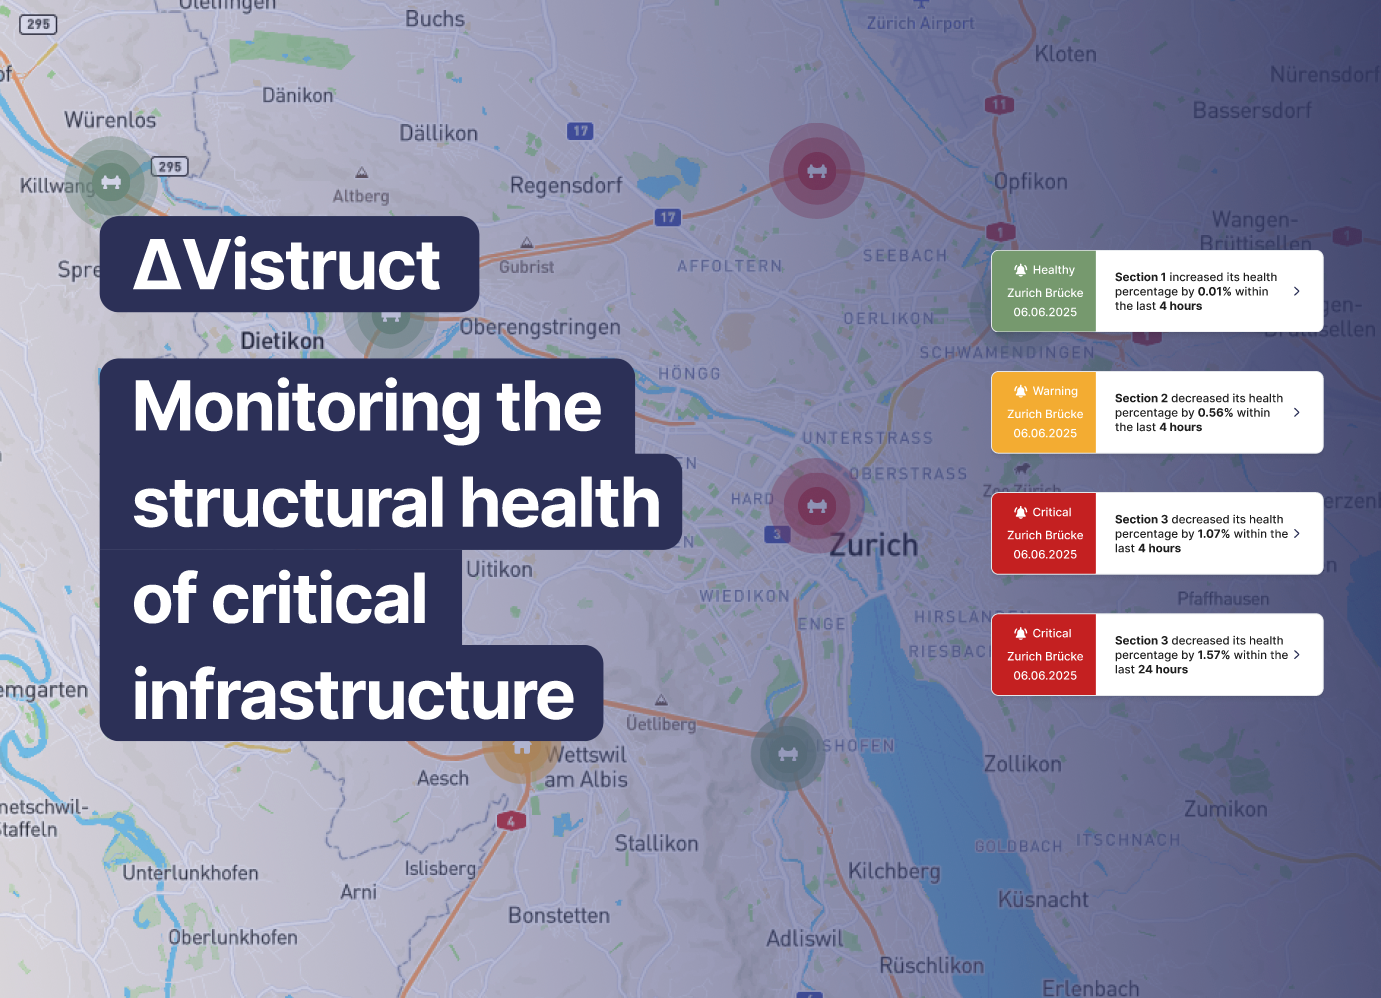
Initial situation
Critical infrastructure like bridges and buildings must be monitored continuously, yet the existing Alpha version in use was built primarily for technical users, such as civil engineers. It allows users to view measurements from sensors installed on the bridge and inspect basic metadata for each monitored asset. The system also provides simple charts and tables to explore collected data, and the ability to export data for offline analysis. However, navigation is cumbersome, loading times increase significantly with larger datasets, and visualizations rely on highly technical terminology and formats that non-engineers struggle to interpret. As a result, asset owners lack a clear, accessible overview of structural health and have difficulty making maintenance decisions based on the data. Furthermore, the application induces large amounts of extraneous cognitive load.
Problem statement / Project goal
To improve the monitoring of critical infrastructure such as bridges, the usability concerns of the Alpha web application should be addressed by a new solution. The project set out to create a time-responsive, scalable, and user‑friendly web interface that empowers asset owners to assess infrastructure health quickly and confidently. The objectives were to make complex information easier to understand, to reduce cognitive load through clear language and consistent visuals, and to improve performance for large amounts of data. This should allow the non-technical users to make better, faster, and easier maintenance decisions.
Map Overview
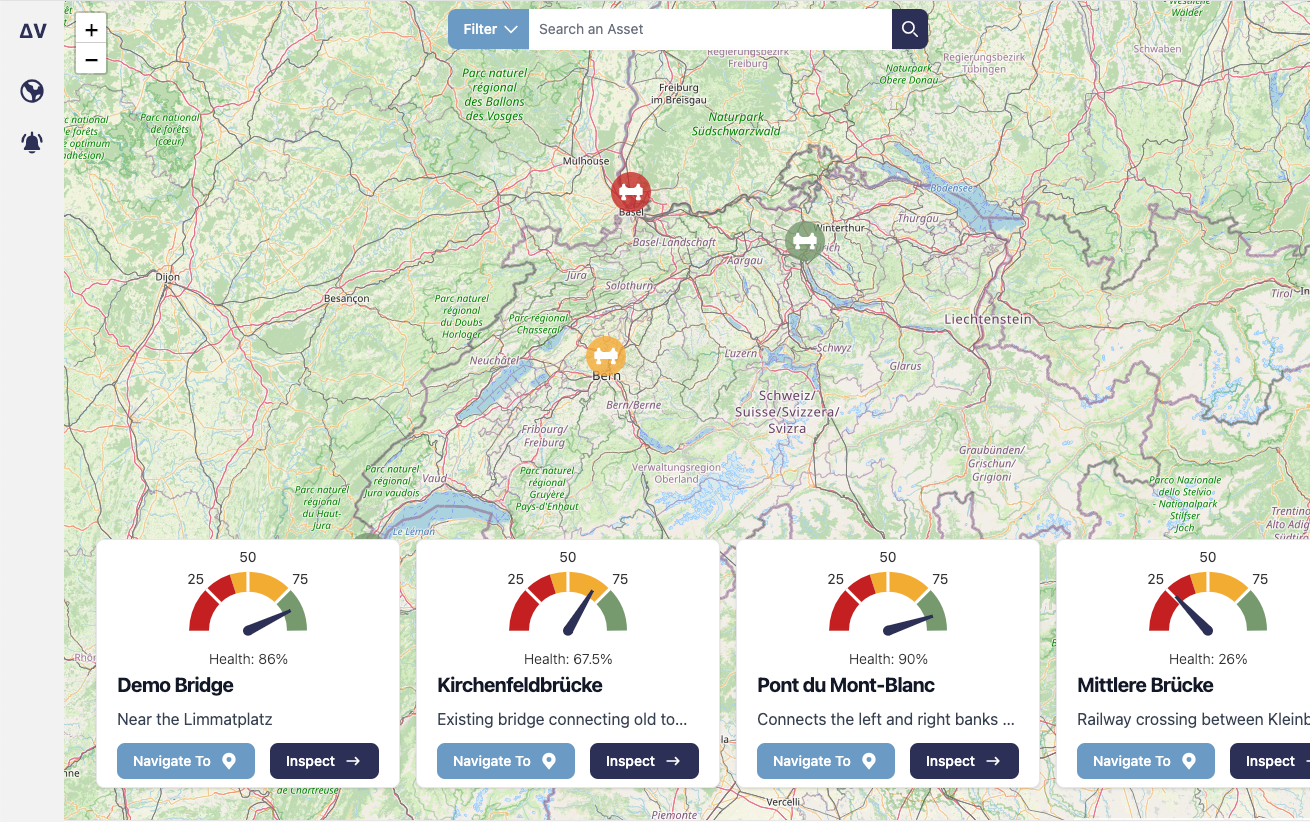
The interactive map gives a geospatial overview of all monitored assets. Color-coded, pulsating markers indicate health status at a glance. A built-in search and filter bar, combined with a card carousel, enables quick navigation to individual assets for deeper inspection.
Digital Twin
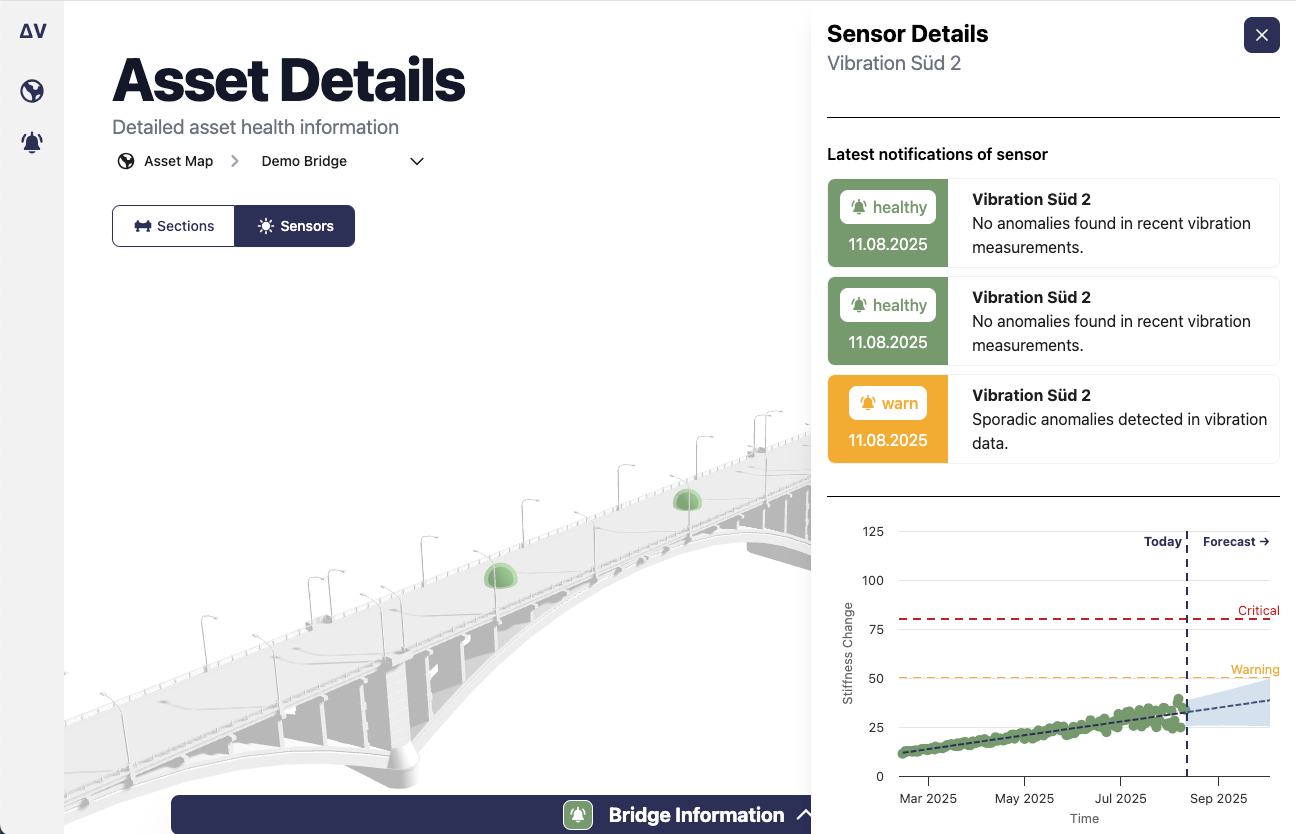
The 3D Digital Twin view provides a spatial representation of a structure with health indicators directly on sections or sensors. Users can click elements to open contextual details, historical trend diagrams, and recommended actions, enabling a clear bridge between data and the physical asset.
Notification Center
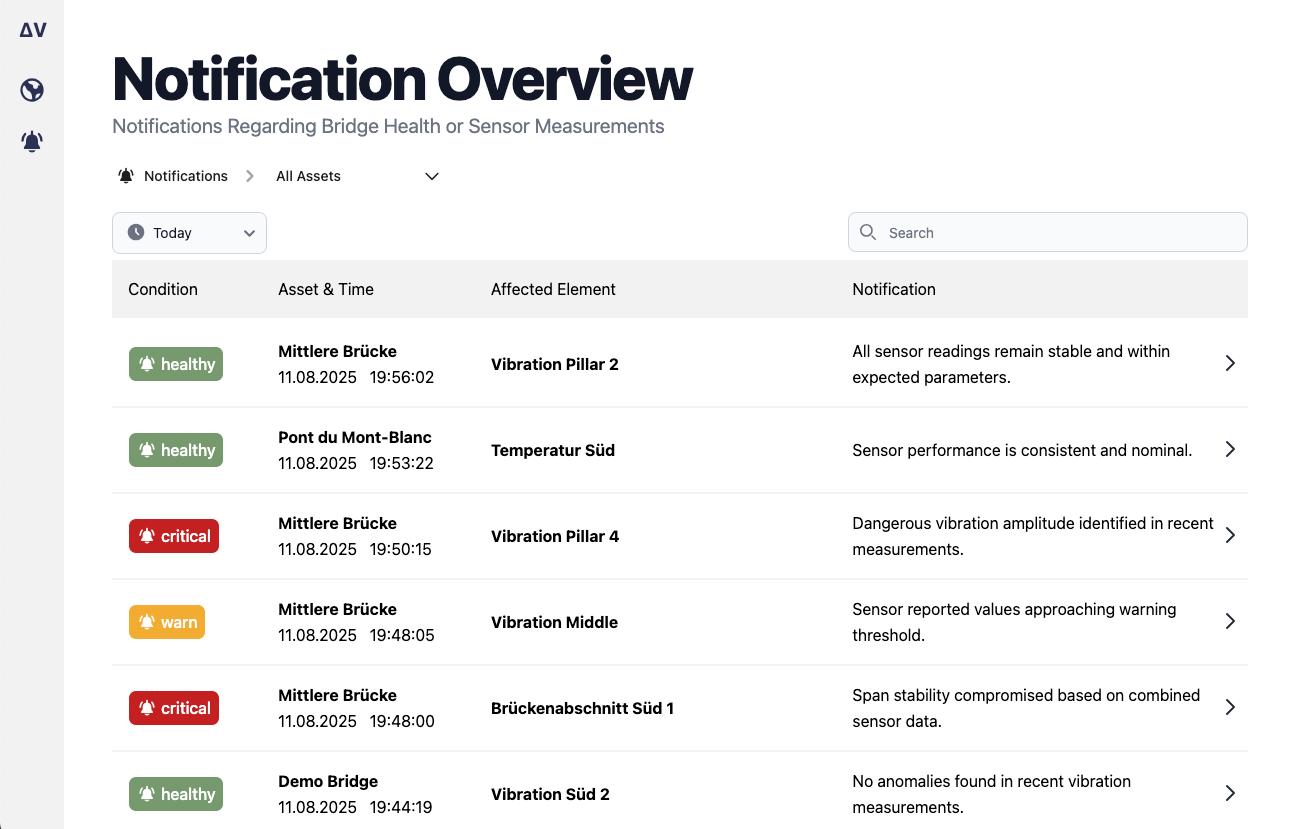
The Notification Center aggregates recent and critical events across all assets. A filterable, searchable list ensures that important changes are not missed, even if the platform is accessed only occasionally. Clicking a notification leads directly to the affected asset and element.
Developed Solution and Its Benefits
The developed prototype, called Vistruct, provides an integrated platform that significantly improves how asset owners monitor and manage critical infrastructure. It combines multiple visualization and interaction modules to turn complex sensor data into actionable information. The resulting platform integrates:
- Geospatial map overview for quick status assessment
- 3D Digital Twin visualizations for spatial context and detailed condition insights
- Centralized Notification Center for exception-driven monitoring
- Signal-based architecture with multi-level caching for responsive handling of data volumes exceeding one million rows
- Consistent, color-coded UI design to guide user attention
- Interactive charting for historical trends and forecast-based health condition change
These features deliver faster, more accurate decision-making, reduce operational workload, and allow proactive maintenance strategies that extend the lifespan of critical infrastructure.
Key terms
- LanguagesTypeScript
- LibrariesAngular, StorybookJS, Three.js, LeafletJS, TailwindCSS
- Core FocusDecision-Making Support, Cognitive Load, Scalable Frontend Architecture
- Visualization3D Digital Twin, Geospatial Map, Interactive Charts
- ArchitectureSignal Store Pattern, Multi-level Caching
Customer
Due to a signed non-disclosure agreement, the client's identity and company details cannot be published. All project descriptions and visuals are anonymized accordingly.
Team
Sven Ziörjen
Jan Zimmermann