
GRADE is a Kotlin and Compose for Desktop library for building highly interactive, chart-based, graphical analysis tools for desktop applications.
Kotlin, Compose For Desktop, Interaction Design, UI-Engineering, Data Analysis, Charts
The goal of GRADE is the development of a Compose for Desktop library for producing graphical, highly interactive, chart-based analysis tools for desktop applications. It must provide the ability to display time-related data and be easily applied to new data sets. The end users in the UI, data analysts and business clerks, must be able to explore and analyze multi-dimensional data sets with the visualizations produced using the library.
The library should provide reusable UI components that developers can use to quickly build an analysis tool. Developers should have to do minimal configurations yet have enough flexibility to configure the analysis tool to the specific use case and data set.
Additionally, the library's features should be illustrated via a demo application, using real data, to show the potential of the chart-based analysis tool.
An overarching goal of the project is to discover how advanced the Compose for Desktop component in Compose Multiplatform is so far. Any missing features or elements should be investigated and evaluated.
In the project “Business Charts in Compose” (IP5 project) a small library for building graphical charts was implemented. It was built in Kotlin and the Compose for Desktop component of Compose Multiplatform, using the Canvas Composable to draw charts. That project's resulting library allowed the visualization of numeric, two-dimensional data into a line chart or scatter plot. It also offered minimal interactions with the chart: Displayed data sets could be hidden or shown, two text fields per axis allowed zooming in on an axis, and on hover, datatips showed detailed data point values. The library created in the IP5 project - “Business Charts in Compose” - served as the basis for this project.
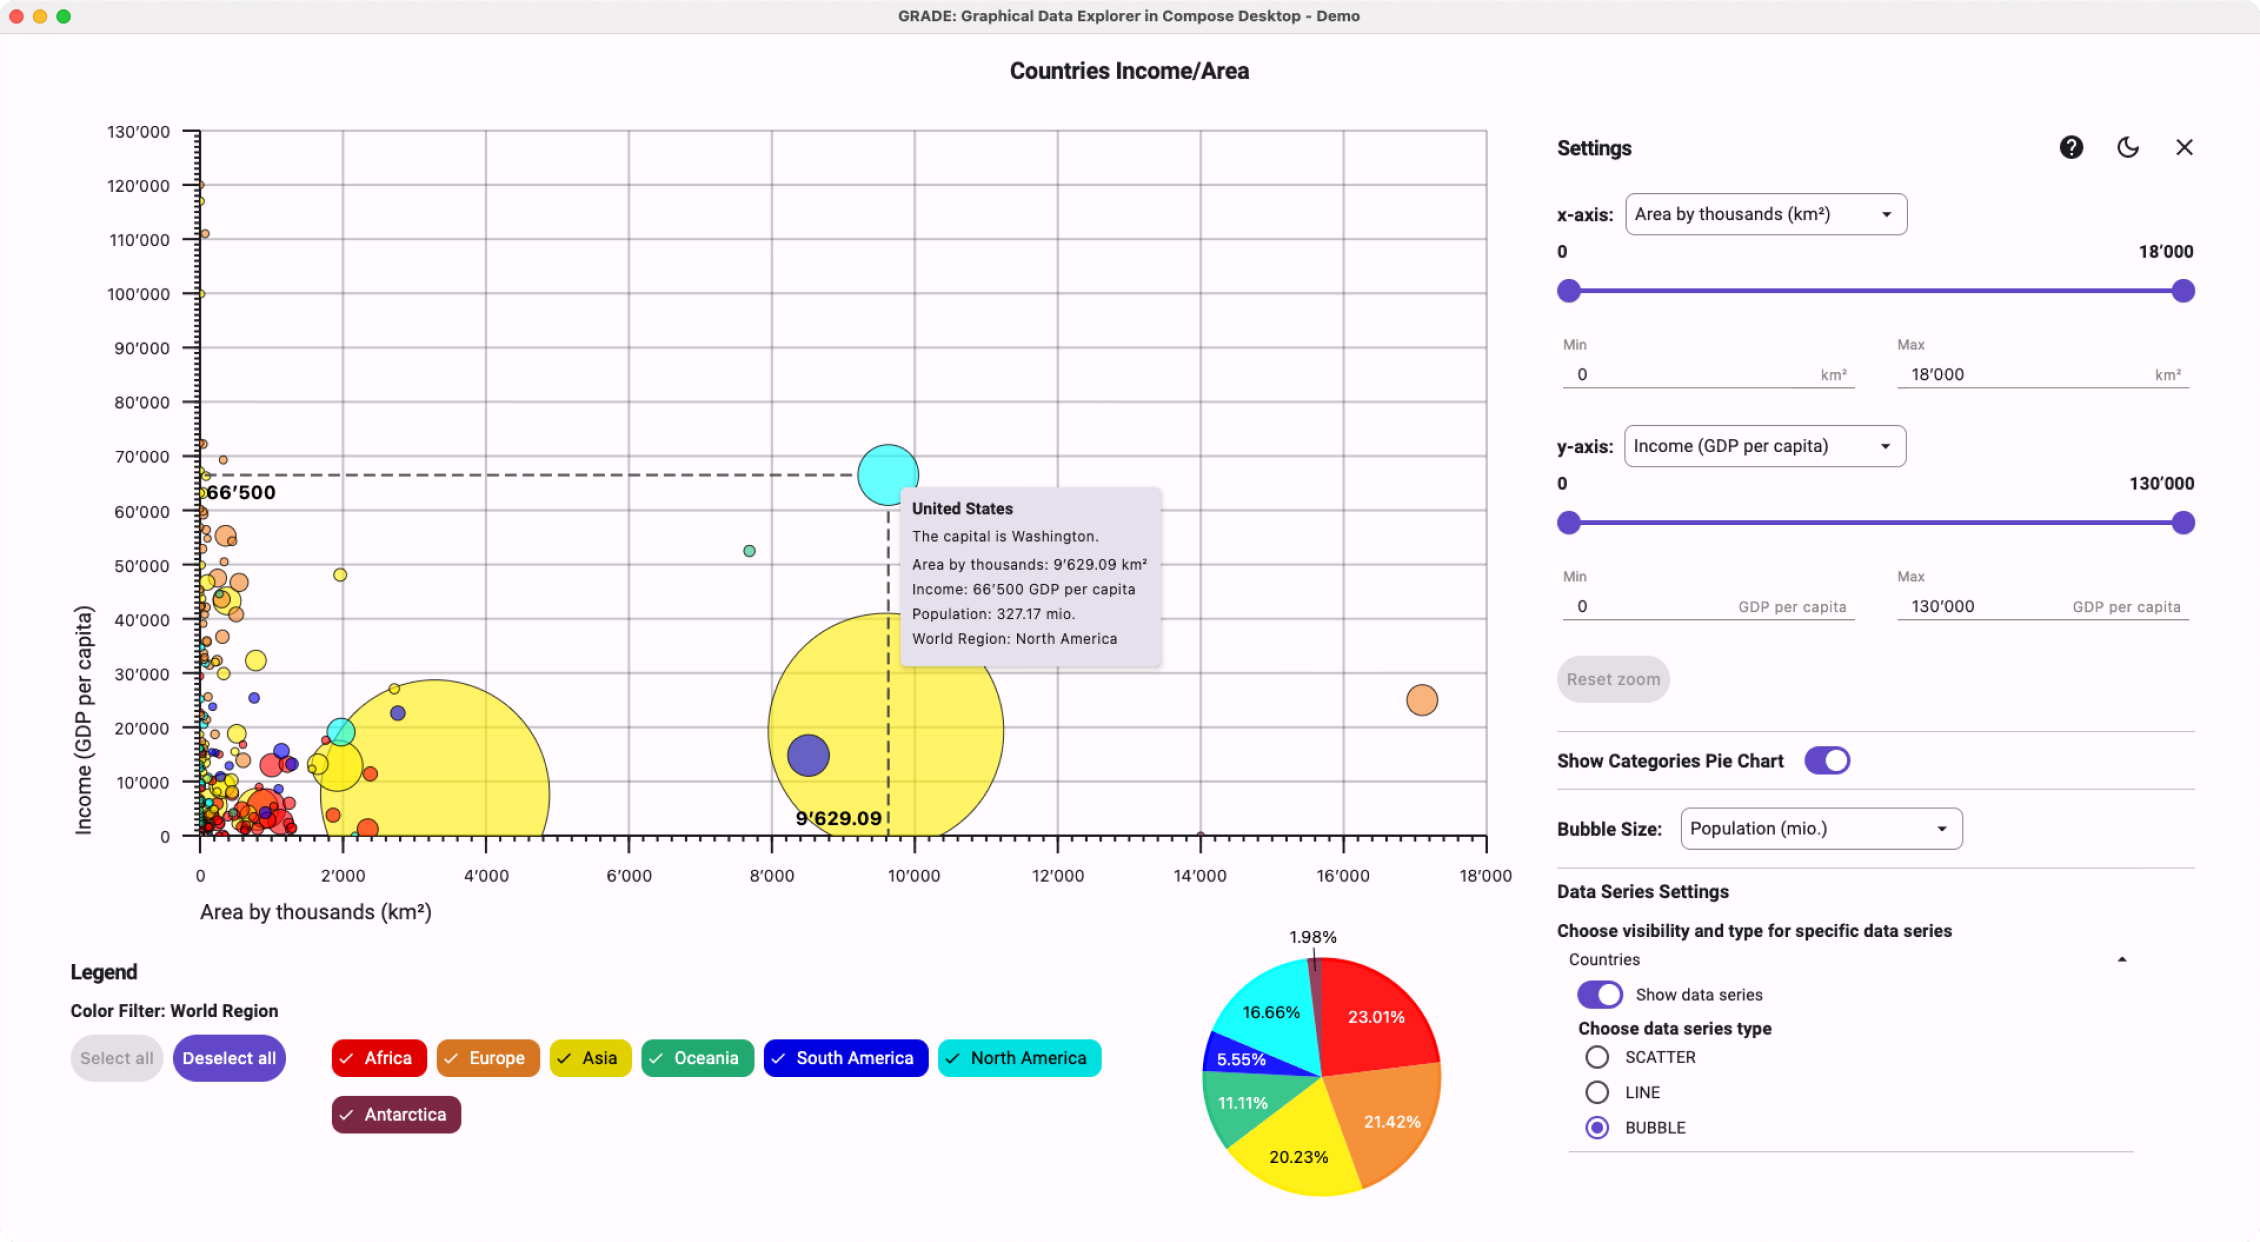
A library was developed which developers can use to create highly interactive analysis tools that visualize multi-dimensional data in the form of scatter plots, line charts or bubble charts. The maximum number of data dimensions that can be displayed at the same time is five: three numeric dimensions, one time-related dimension and one categorical dimension.
The developers' efforts to create such an analysis tool are kept low: They must only create an XYChart object with their data in the form of data point objects and can add the tool to the UI with one line of code. They can configure and style the tool to their specific use case. The library significantly reduces the amount of time a developer of a Kotlin/Compose application needs to display an analysis tool, from multiple days to minutes.
Data analysts and business clerks can easily explore and analyze the visualized data in the XYChart. The tool offers many interactions that allow filtering, zooming and detailed comparisons.
The library was implemented using the MVC paradigm and the action concept, where an action is triggered in the UI and the Controller of an element is informed of it via an Action. The Controller then updates the Model, which causes a recomposition of the View, causing the changes to be visible to the user.
| Project type: | Computer Science Project 6 |
| Project duration: | 20.02.2023 - 18.08.2023 |
| Effort in hours: | 360 per person |
| Team size: | 2 People |
Dr. Dieter Holz Institute of Mobile and Distributed Systems Fachhochschule Nordwestschweiz FHNW Campus Brugg-Windisch Bahnhofstrasse 6 5210 Windisch
Alison Fersch, 8iC, alison.fersch@students.fhnw.ch
Dinah Bolli, 8iC, dinah.bolli@students.fhnw.ch
Dr. Dieter Holz, dieter.holz@fhnw.ch
Prof. Dierk König, dierk.koenig@fhnw.ch
