
Interactive Visualisation Dashboard for Cancer Registry Data
A web-based prototype for exploring cancer incidence and mortality data through interactive charts, filters and regional comparisons.
Initial situation
Cancer registries collect information that can be used to monitor cancer incidence, mortality and long-term developments. The available data contains many dimensions, including tumour locations, age groups, genders and regions.
When this information is presented mainly through static reports and tables, answering a specific question can require users to work through several different representations. Relationships between groups or changes over time are also not always immediately visible.
Problem statement / Project goal
The project focused on designing a dashboard that allows users to investigate cancer registry data directly instead of relying on predefined views. The interface should support common tasks such as finding specific cancer types, comparing Bern and Solothurn, and examining developments across different population groups.
An additional goal was to keep the interface approachable despite the complexity of the underlying data. The project therefore considered both the choice of visualizations and the number of interactions required to reach relevant information.
The prototype was developed using mock and synthetic data so that the visualization and interaction concepts could be implemented without exposing real patient information.
Solution developed and its benefits
The prototype was implemented as a client-side web application using HTML, CSS and JavaScript. CSV files provide the underlying data, while D3.js is used for data handling and Plotly creates the interactive visualizations.
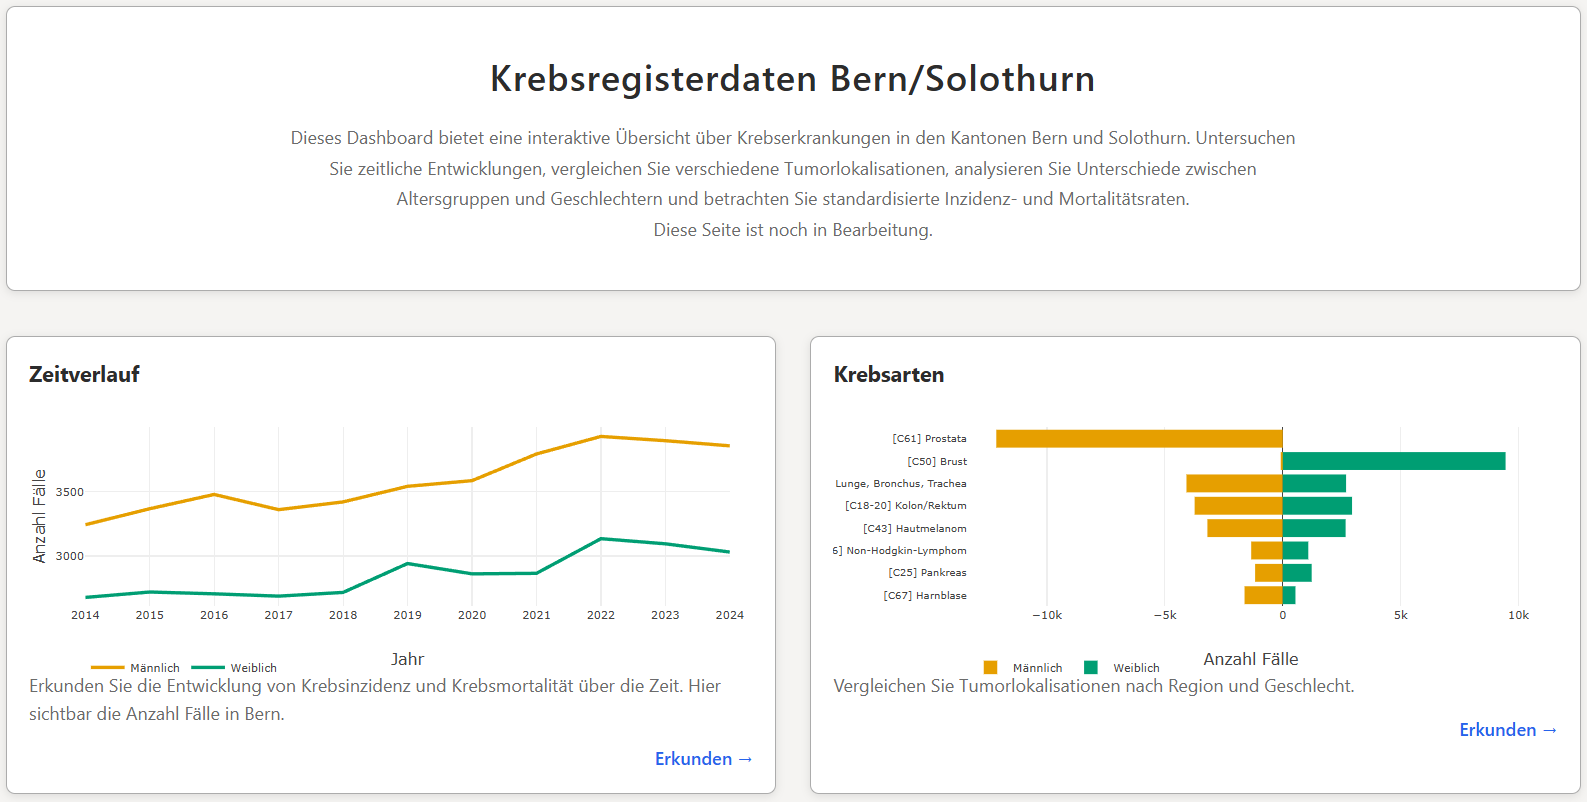
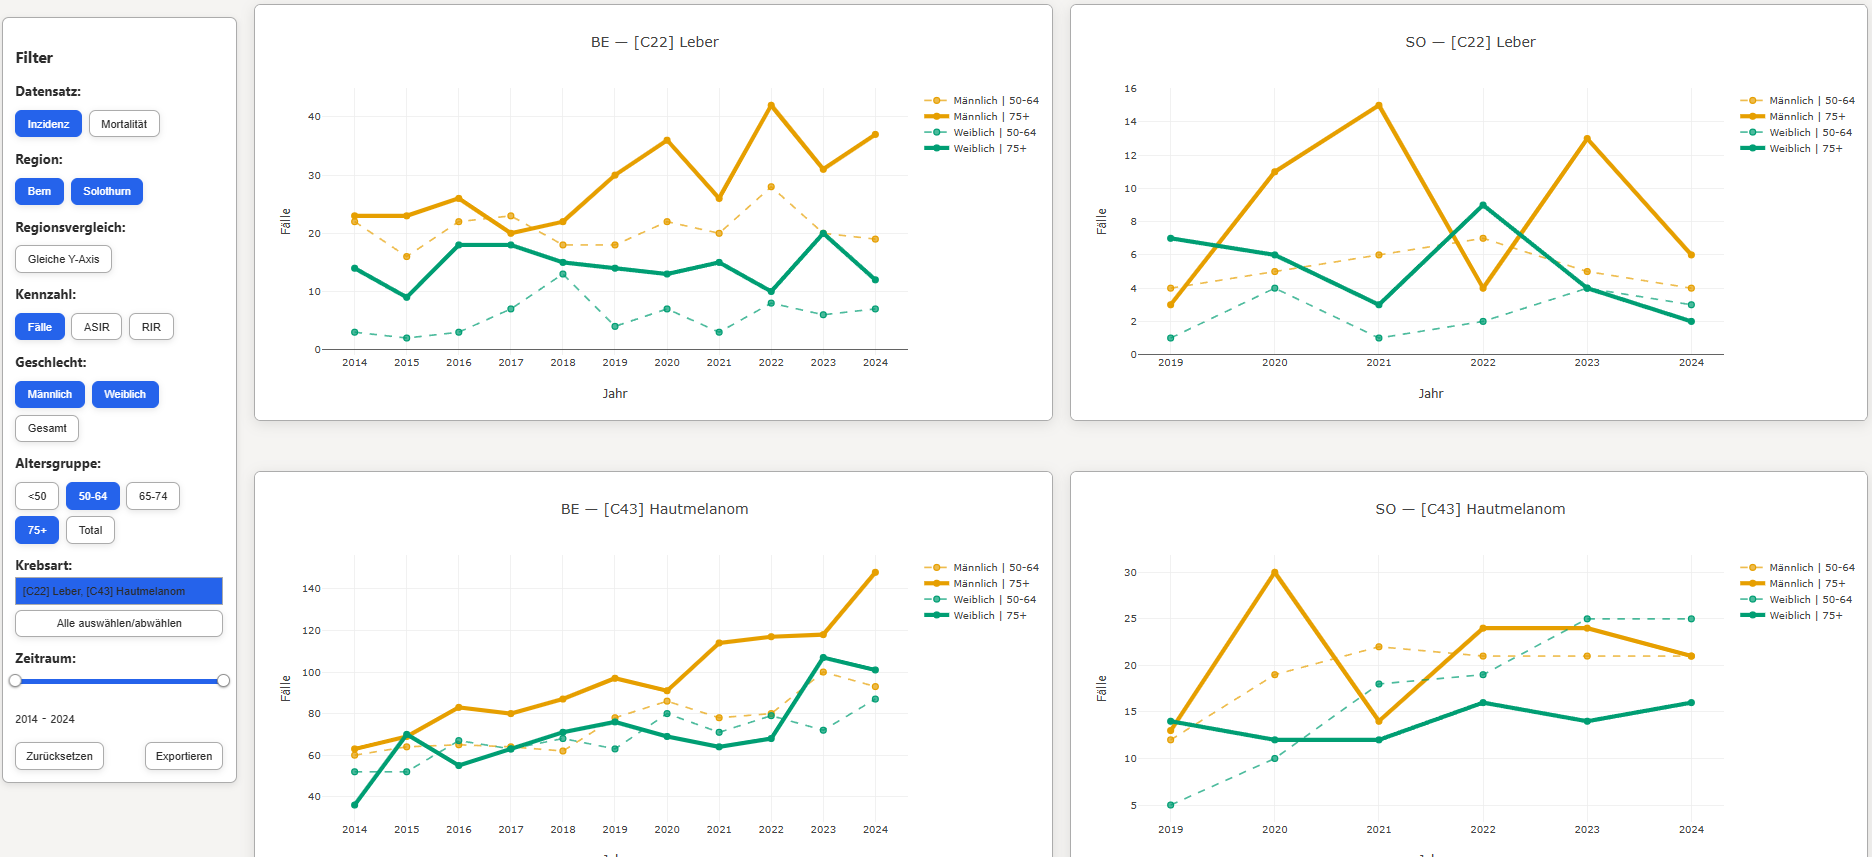
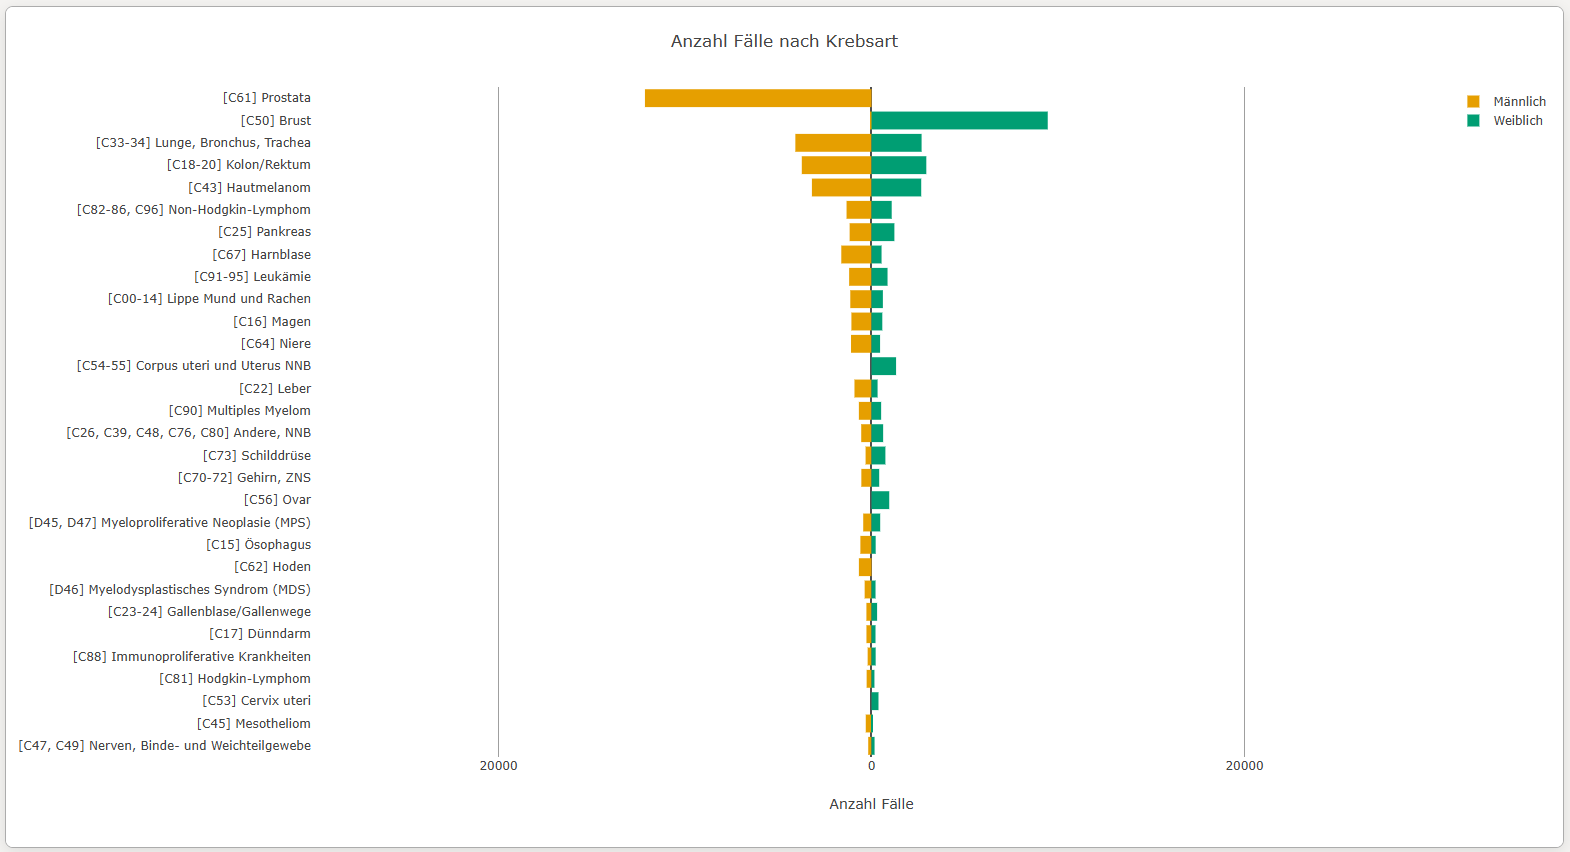
The dashboard contains two main views. Time trends show changes in incidence and mortality across the selected years, while Cancer types provides a direct comparison of tumour locations. A sidebar combines filters for region, dataset, gender, age, cancer type and year range.
The visualizations were refined throughout the development process. This included adapting chart scales to the selected data, improving the presentation of different population groups and simplifying interactions where possible. User feedback was used to identify problems with the interface and guide subsequent adjustments.
- compare cancer statistics between Bern and Solothurn
- switch between incidence and mortality data
- examine cases and standardized rates
- filter results by cancer type, age, gender and year
- identify temporal trends and differences between population groups
- explore the data without modifying the underlying dataset
The resulting prototype demonstrates how an interactive interface can complement conventional cancer registry reports. Its structure also provides a basis for further development with additional datasets, visualizations and user requirements.
Key terms
- Cancer registryincidence, mortality, tumour data
- Data visualizationinteractive charts, visual analytics
- Dashboardfiltering, comparison, data exploration
- Statisticscases, ASIR, RIR, ASMR, RMR
- FrontendHTML, CSS, JavaScript
- VisualizationPlotly, D3.js
- Datamock data, synthetic data, CSV
Customer
Krebsregister Bern Solothurn
Bern, Switzerland
Website Krebsregister Bern Solothurn
Team
Dario Mueller
Advisors
Arzu Coltekin
Laura Fontanesi
Flavia Brogle