
Interactive Cohort Exploration for Radiation Oncology
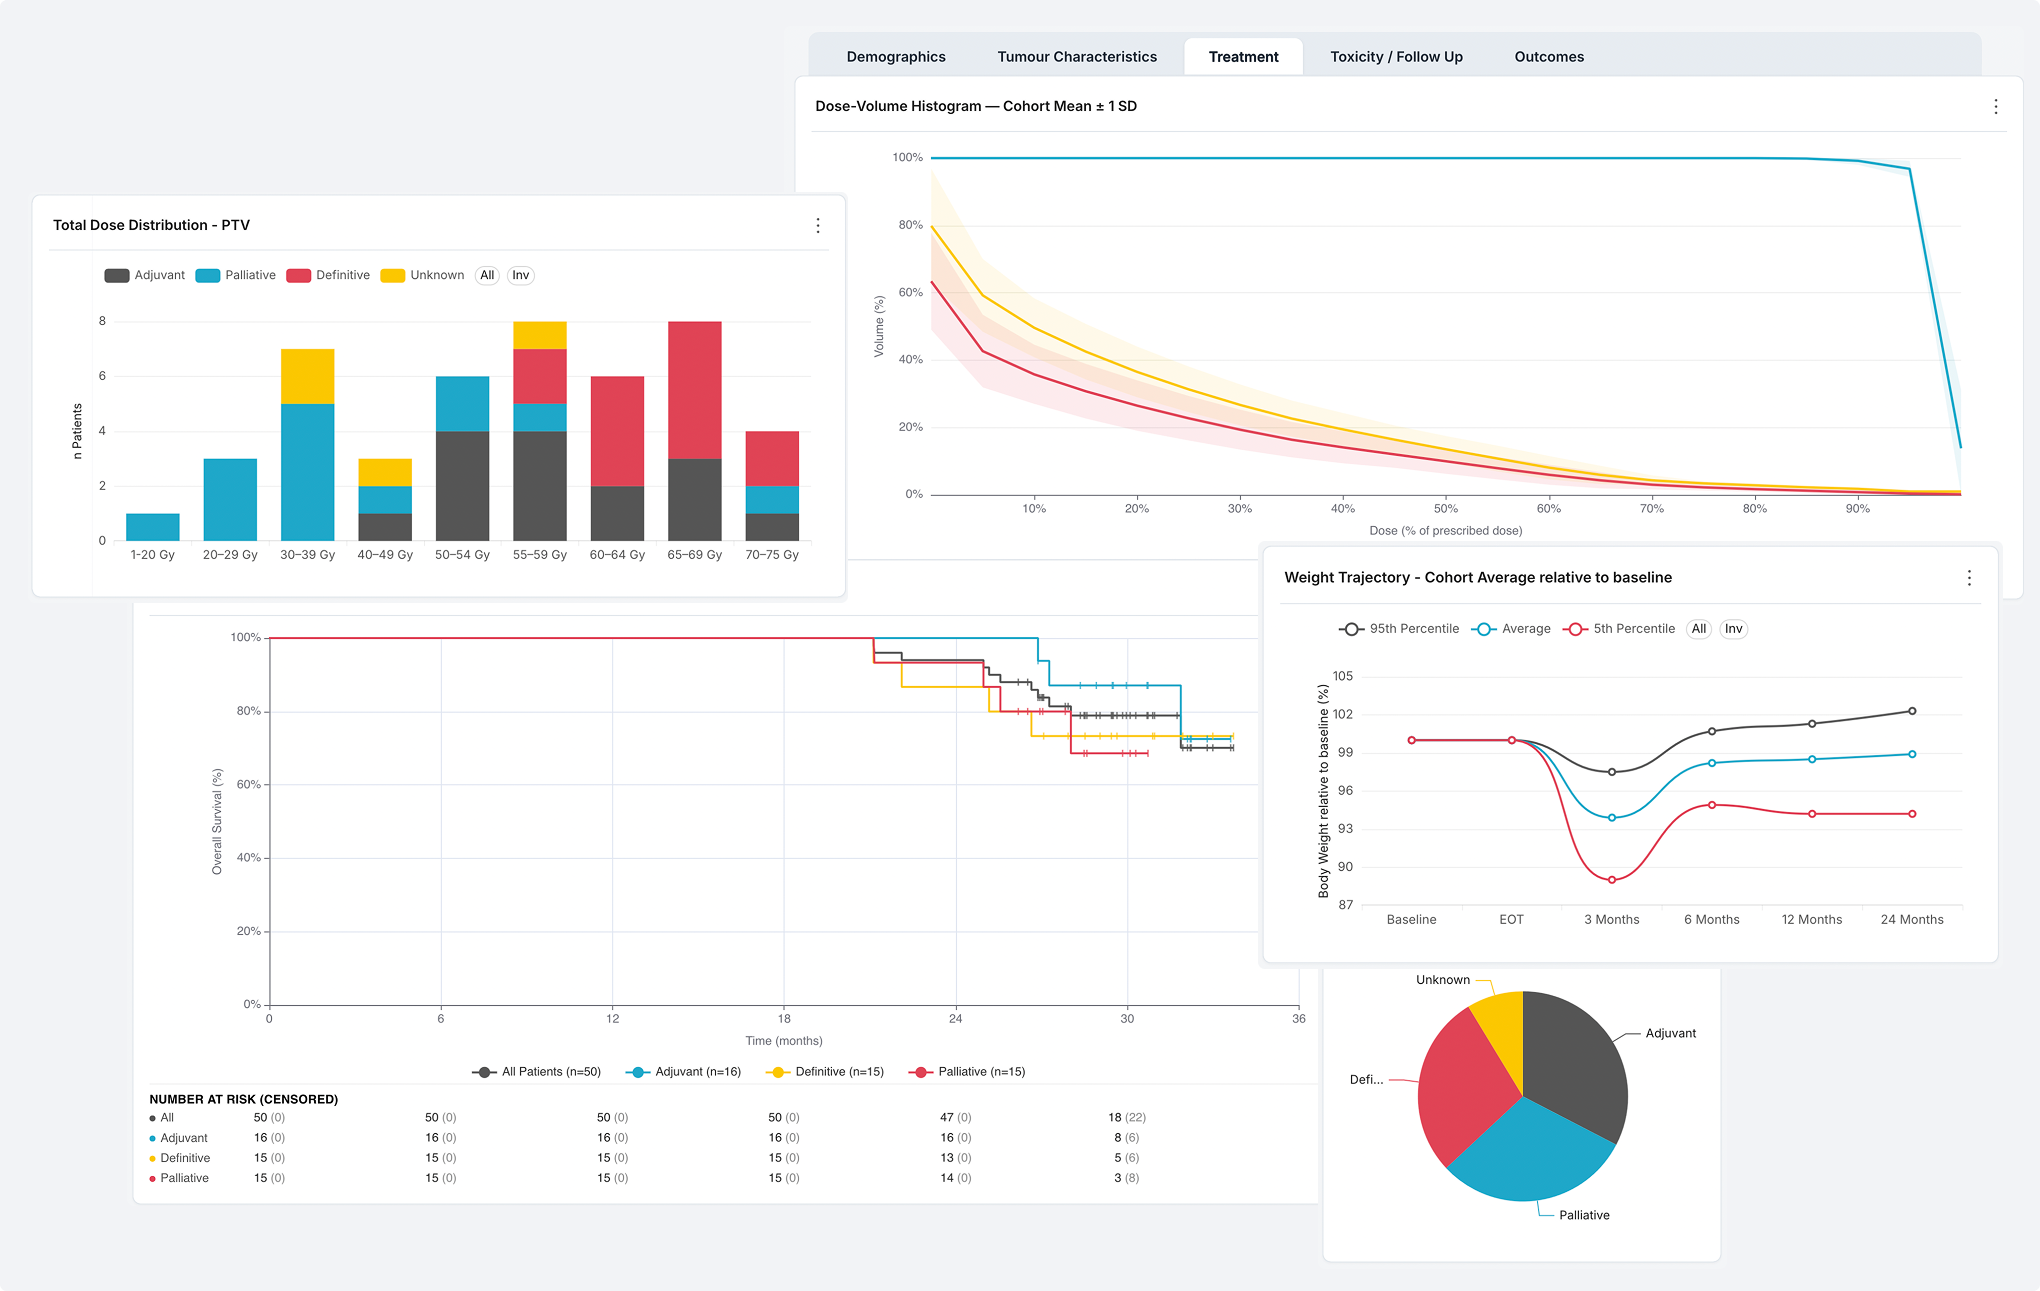
How did patients like this one actually do? Answering that used to mean a data request, an export and a manual analysis by someone else. This dashboard turns a curated research database into a web application: define a patient cohort with a few filters and read its treatment and outcome data immediately.
Initial situation
The Center for AI in Radiation Oncology (CAIRO) at the Inselspital in Bern maintains a curated retrospective database of head and neck cancer patients, covering demographics, tumor characteristics, radiotherapy prescriptions, dose distributions, toxicity assessments and survival outcomes. The data is detailed and well maintained. It is also effectively out of reach during clinical work, because getting an answer out of it requires a data request, an export and a manual analysis. A physician preparing a treatment decision cannot quickly ask how a comparable group of patients fared, what dose distributions were achieved for them, or which toxicities appeared during follow-up.
Problem statement / Project goal
The goal was to design and build a web-based dashboard that lets clinicians explore this data at the level of a patient cohort. The clinician sets filter values, and every chart on every panel updates to show only the matching patients. No query language and no database knowledge are required.
The second requirement was that the two chart types radiation oncologists consider indispensable, the Kaplan-Meier survival curve and the dose-volume histogram, had to work inside the platform CAIRO already uses. Neither exists in that platform. Both had to be built and had to stay responsive to the same cohort filters as every native chart.
Cohort definition
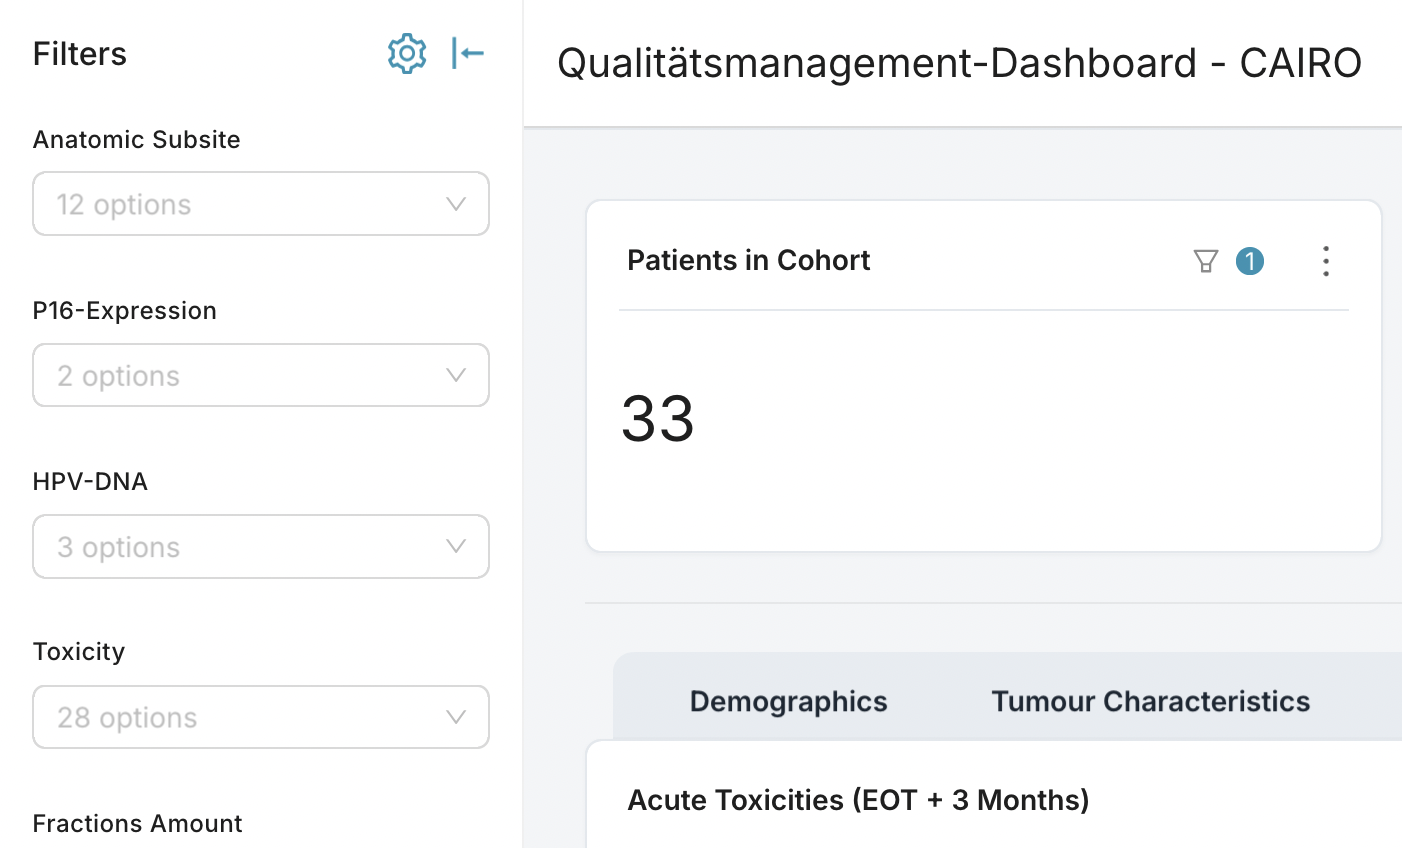
Thirteen filters describe a cohort. The filter bar is available on all five panels, and the current cohort size is displayed at all times.
Outcomes
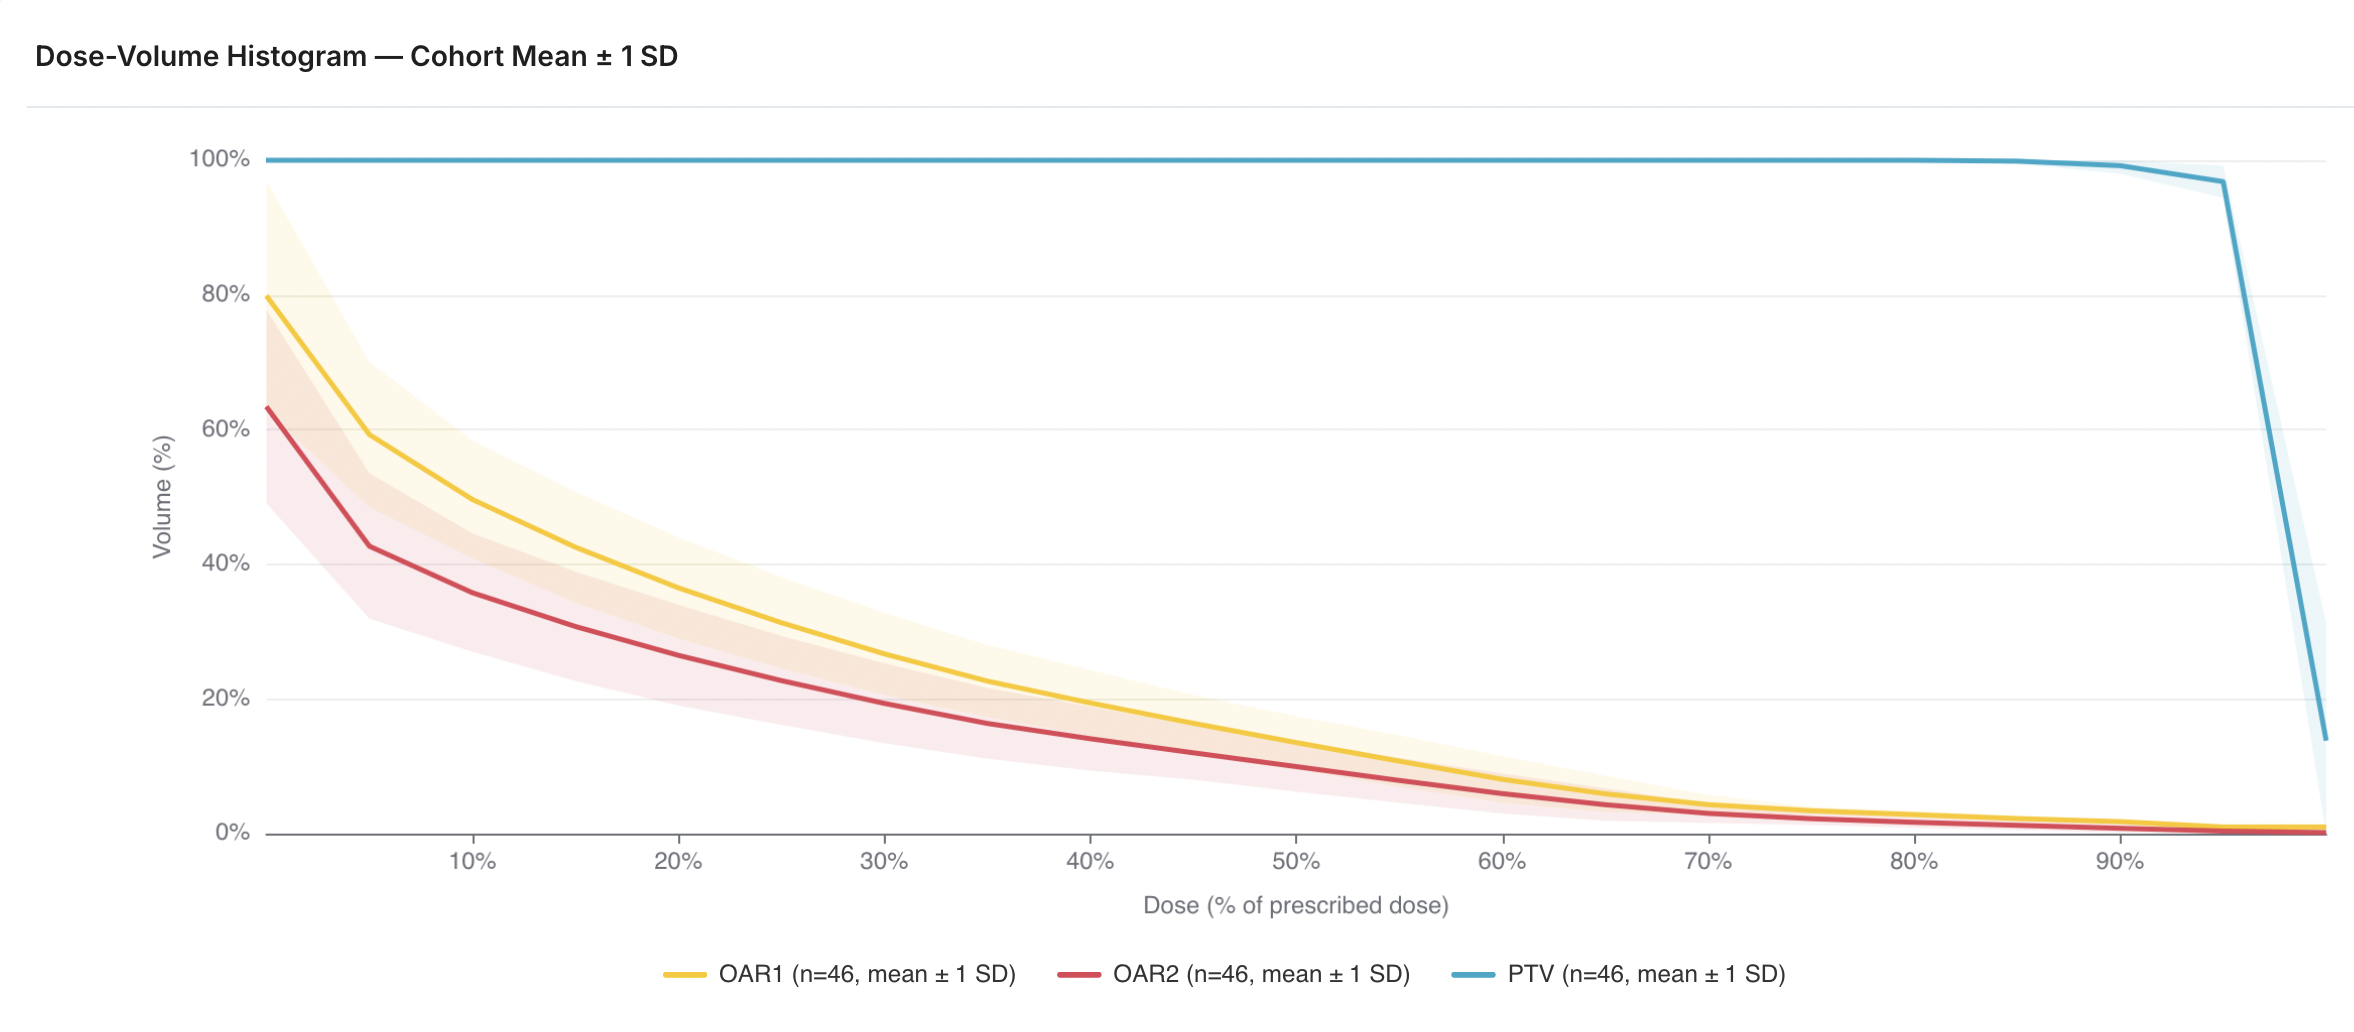
Two custom chart plugins were developed in TypeScript and React. A Kaplan-Meier plot and a dose-volume histogram.
Cohort size guard
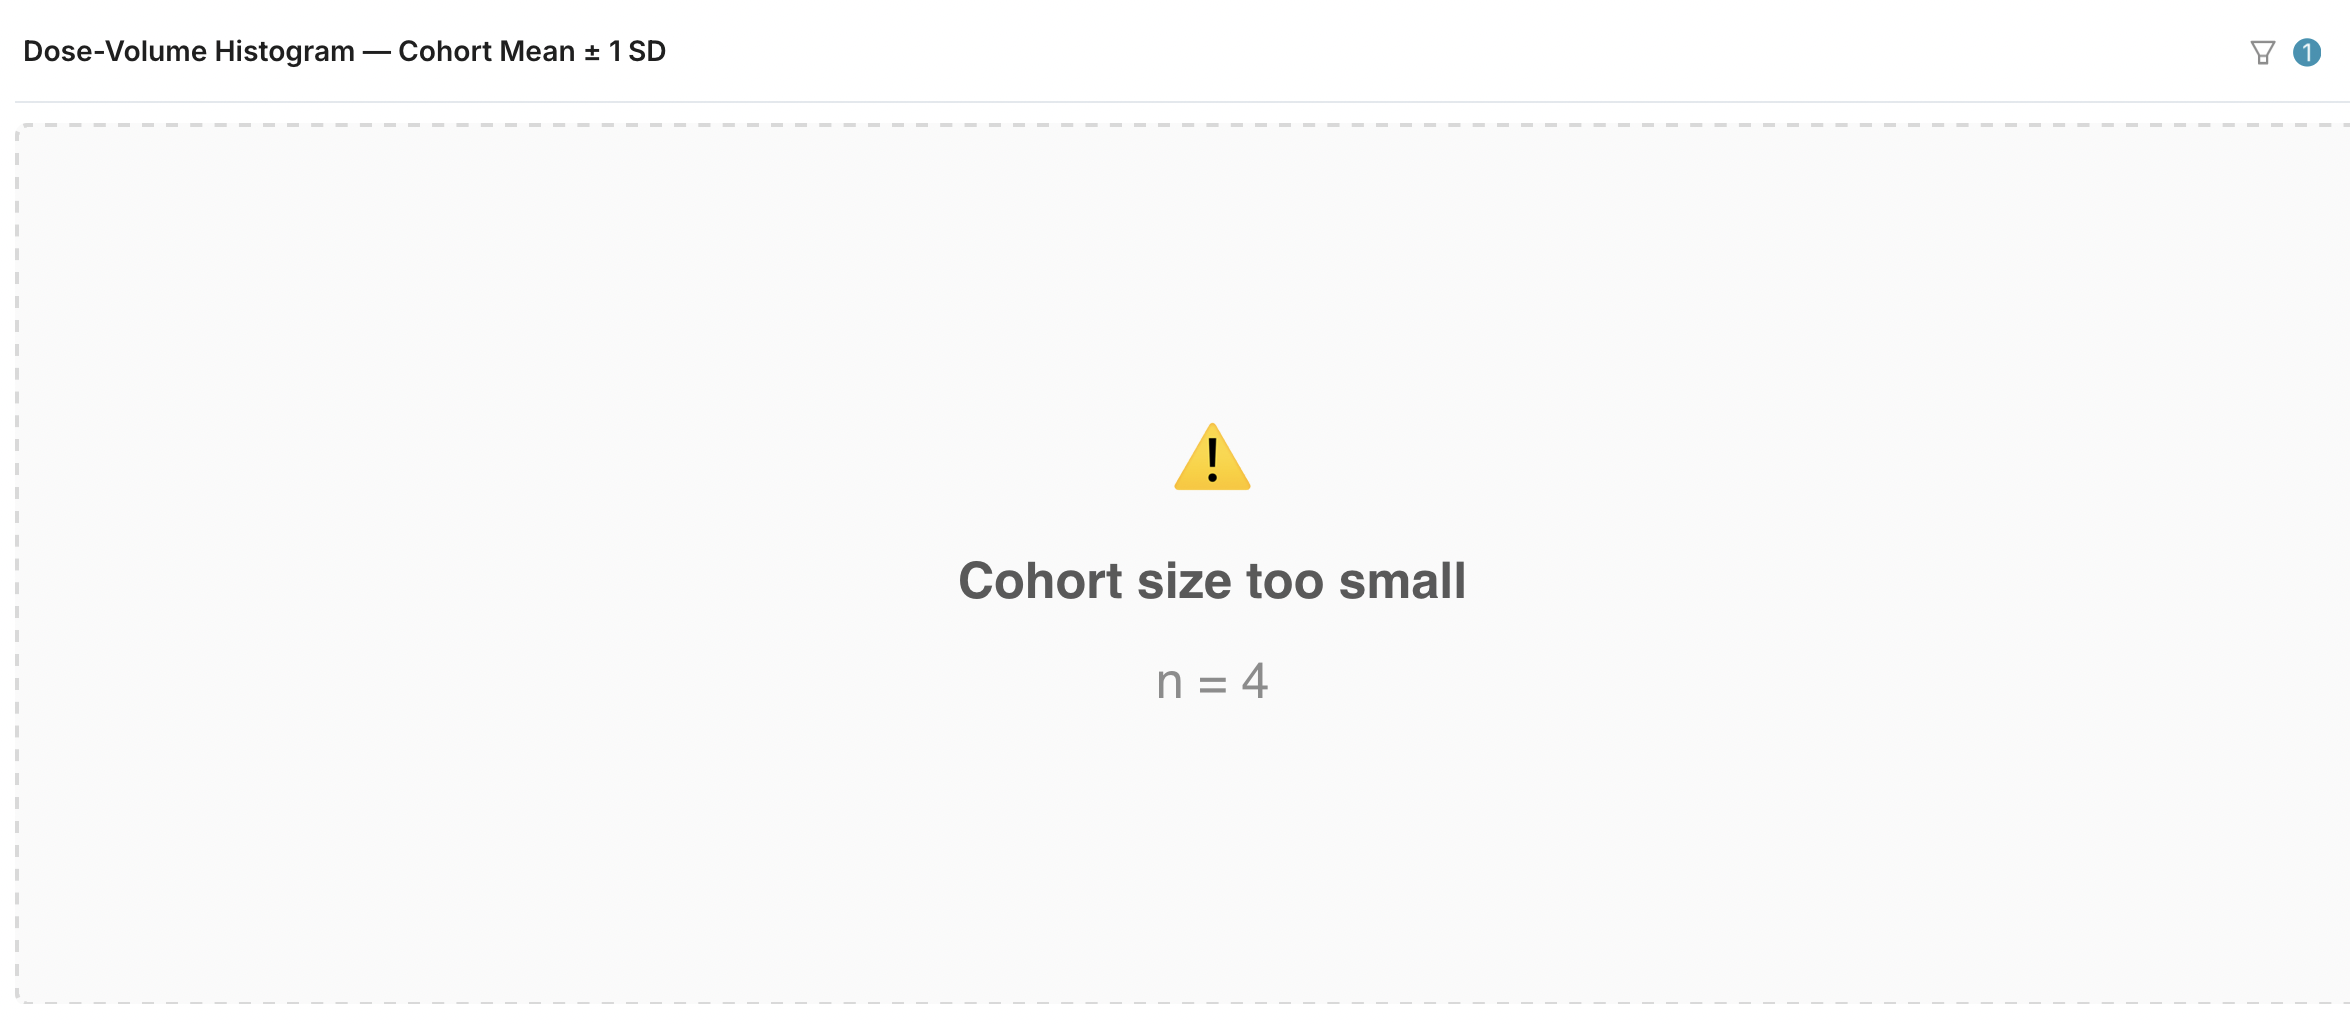
Privacy was treated as a functional requirement and not as a final check. Charts are built to withhold their result when the filtered cohort falls below ten patients, and the custom plugins state the reason and the cohort size instead of rendering an empty chart.
Solution developed and its benefits
The result is a dashboard built on Apache Superset, the analytics platform already established at CAIRO, extended with two custom chart plugins. A Python pipeline transforms the source workbook into a normalized SQLite database, ten SQL-defined datasets sit on top of it, and the whole stack runs under Docker Compose. The statistical computation for both custom charts was deliberately moved out of SQL and into the presentation layer, which keeps the analytical logic readable and independent of the database engine. The design grew out of an iterative process with the clinicians: semi-structured interviews, three review sessions with think-aloud walkthroughs, and four development iterations, each shaped by the feedback from the last.
The main benefits:
- the two chart types radiation oncologists actually use, working inside a general-purpose analytics platform
- every chart on every panel responds to the same cohort definition, so the whole dashboard always shows one consistent group
- survival curves that follow clinical reporting conventions, including censoring marks and numbers at risk
- dose-volume comparison across a cohort, which the underlying clinical tooling is not built to do
- a minimum cohort size enforced in the charts themselves, so aggregate views cannot expose an individual
- a documented transformation pipeline, so CAIRO can connect the dashboard to its real anonymized data
- extendable to further endpoints and chart types, since each is a plugin instead of a change to the platform
The dashboard was evaluated formatively across three sessions with two practicing radiation oncologists and two members of the CAIRO team, covering both user groups. The feedback shifted over the iterations from structural questions about panels and filters toward detailed questions about statistical presentation, which suggests the tool became precise enough to be judged in clinical terms.
The contribution of this work is not a new statistical method, but the accessibility and the speed of established ones. It also locates the boundary of the approach: a constraint that applies across every chart, in this case the minimum cohort size, is harder to enforce in a platform whose extension points are per chart. The dashboard is a research-stage pilot and is handed to CAIRO for connection to real data.
Key terms
- Clinical domainradiation oncology, head and neck cancer, cohort exploration
- Survival analysisKaplan-Meier estimator, censoring, number at risk
- Dose analysisdose-volume histogram, organs at risk, relative dose
- Data visualizationinteractive dashboard, cohort filtering, custom chart plugins
- FrontendTypeScript, React, ECharts, Apache Superset plugin API, CSS
- BackendPython, SQLite, Docker
- Data protectionminimum cohort size, aggregation, synthetic data
- Methoduser-centered design, semi-structured interviews, think-aloud, iterative prototyping
Customer

CAIRO, Center for AI in Radiation Oncology
Inselspital, University Hospital Bern
Freiburgstrasse 18
3010 Bern
Website CAIRO
Team
Matthias Liniger
Advisors
Arzu Cöltekin
Laura Fontanesi
Flavia Brogle