
Interactive Data Visualization for Assessing the Environmental Impact of Tunnel Construction
How much CO2 does a tunnel cause? Answering that used to require an expert and a complex Excel model. This dashboard turns the life cycle assessment of EuroTube into a web application: configure a tunnel in a few clicks and see the effect of every design decision immediately.
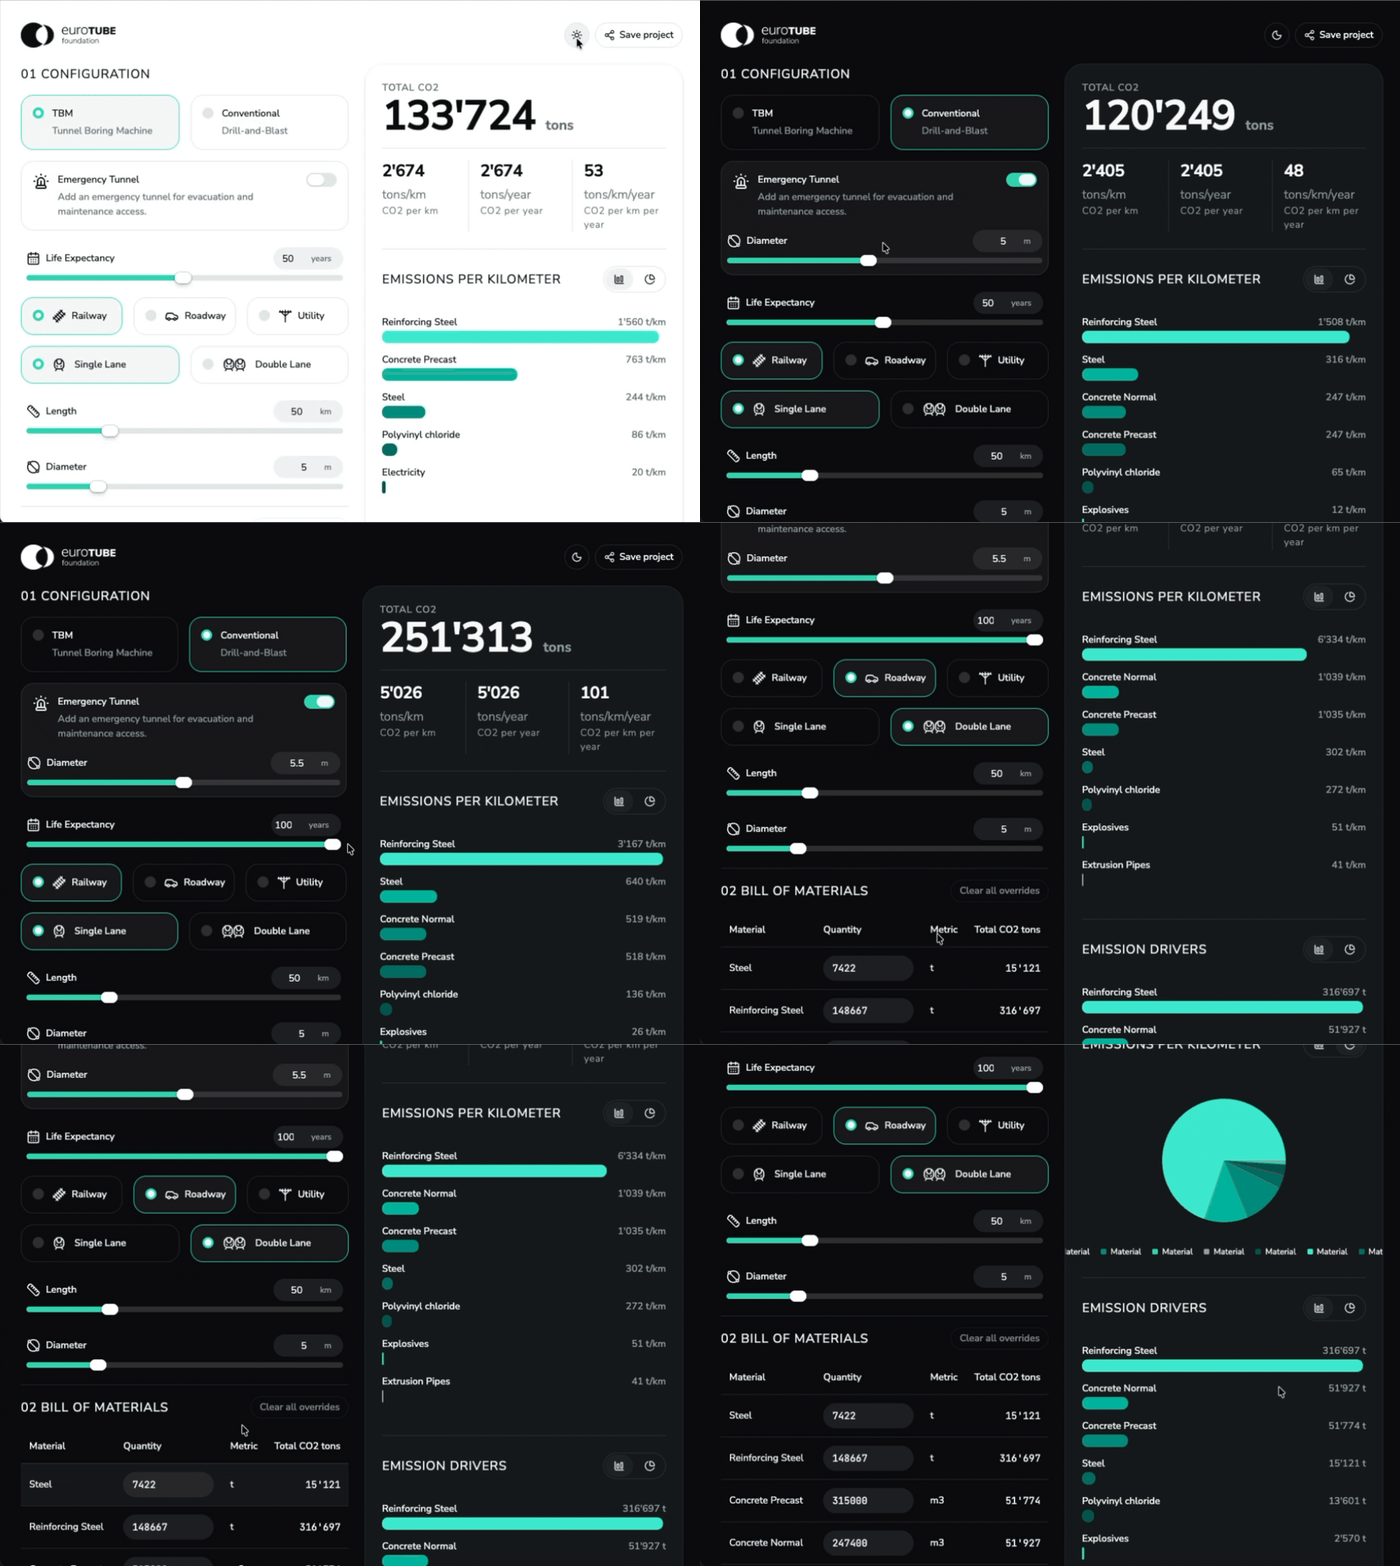
The dashboard: tunnel configuration on the left, the
resulting emissions on the right
Disclaimer: The numbers in the dashboard are
for demonstration purposes only and do not reflect the actual
CO2 emissions of a tunnel.
Initial situation
EuroTube is a non-profit research company in Zurich that assesses the environmental impact of infrastructure projects for industry partners. Its life cycle assessment (LCA) models exist as extensive Excel tools. They deliver well-founded results, but only specialists can operate and interpret them. The outcome is therefore hard to communicate to the engineers and planners who actually take the design decisions, and hard for EuroTube to demonstrate to partners and clients.
Project goal
The goal was to design and implement a web-based interactive dashboard that makes these life cycle assessments accessible. Instead of copying the spreadsheet, the models were to be translated into an application in which users adjust parameters such as construction method, use case, length or diameter and observe the effect on the CO2 emissions directly.
Maintainability was the second requirement: the expertise of the EuroTube team lies in scientific modelling, not in frontend development. New algorithms, parameters and data sets have to be integrable without knowledge of the user interface. Tunnel construction is the first application case, the concept is designed to be extended to other types of infrastructure.
Configuration
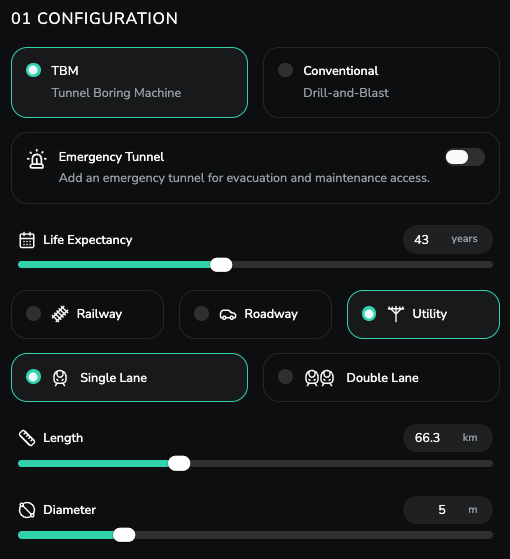
Seven parameters describe a complete tunnel: construction method, use case, lanes, length, diameter, service life and an optional emergency tunnel. Options stay visible as cards, dimensions are set with sliders.
Results
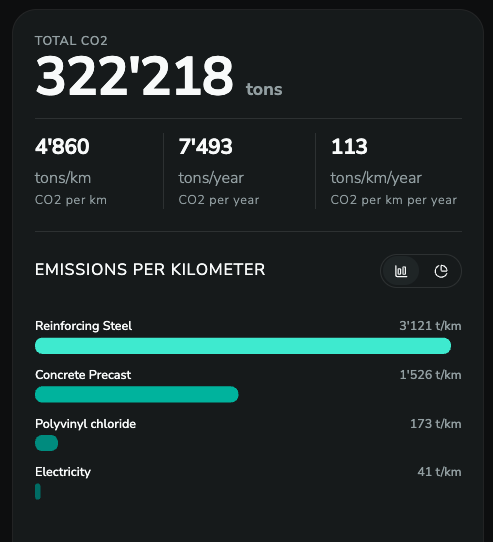
Four key indicators show the total emissions and the emissions per kilometre and per year. Interactive charts reveal which materials drive the result, and update with every change.
Bill of materials
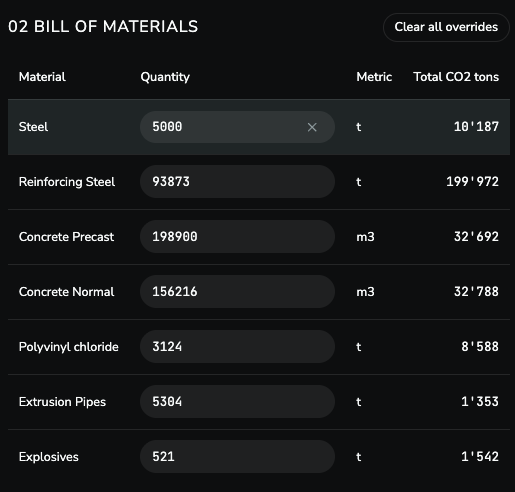
The calculated bill of materials stays visible instead of hidden in a black box. Experts can override individual quantities with their own values and refine the assessment.
Solution developed and its benefits
The result is a React frontend with a Python backend. Users configure a tunnel, the backend derives the geometry, generates the bill of materials and calculates the CO2 emissions, and every parameter change updates the charts immediately. The design grew out of a user-centred process with EuroTube: interviews, sketches by the users themselves, personas and several iterations of mock-ups. The calculation logic is split per construction method, use case and tunnel component, so a new component is a new class instead of a change to the existing model.
The main benefits:
- a life cycle assessment in a few clicks instead of an Excel model for specialists
- immediate visual feedback on how a design decision changes the CO2 emissions
- emissions per kilometre and per year make projects of different size comparable
- two levels of detail: a quick assessment for non-experts, an editable bill of materials for engineers
- transparent results, because every material quantity remains visible
- the configuration is stored in the URL, so every assessment is shareable as a link, without a database or accounts
- extendable to further construction methods, use cases and other types of infrastructure
The dashboard was evaluated with a managing director and a civil engineer from EuroTube, covering both main user groups. Both completed all tasks without assistance and rated the application with an average of 88.75 out of 100 points on the System Usability Scale, clearly above the 80.3 points of the highest category. The findings from the test concerned the presentation of information and were largely implemented.
The contribution of this work is not a new calculation model, but the accessibility and the speed of an existing one. The life cycle assessment is no longer a report at the end of a project, it becomes a tool that is used while the design decisions are taken.
Key terms
- Life Cycle AssessmentLCA according to ISO 14044
- SustainabilityCO2 emissions, circular economy
- Tunnel constructiontunnel boring machine, drill and blast
- Data visualizationinteractive dashboard, charts
- FrontendReact, TypeScript, Vite, Tailwind CSS
- BackendPython, FastAPI, REST API
- Architecturestrategy pattern, extensibility
- Methoduser-centered design, usability testing
Customer

EuroTube Foundation
ETH Hangar
Wangenstrasse 72
8600 Dübendorf.
Website EuroTube
Team
Olivier Huguenot
Joshua Rost
Advisor
Kevin Kim