
Interactive Dashboard for Longitudinal Analysis of Digital Sustainability Survey Data
An interactive web dashboard for IREB's (International Requirements Engineering Board) digital sustainability survey data. We visualize longitudinal trends and make results publicly accessible.
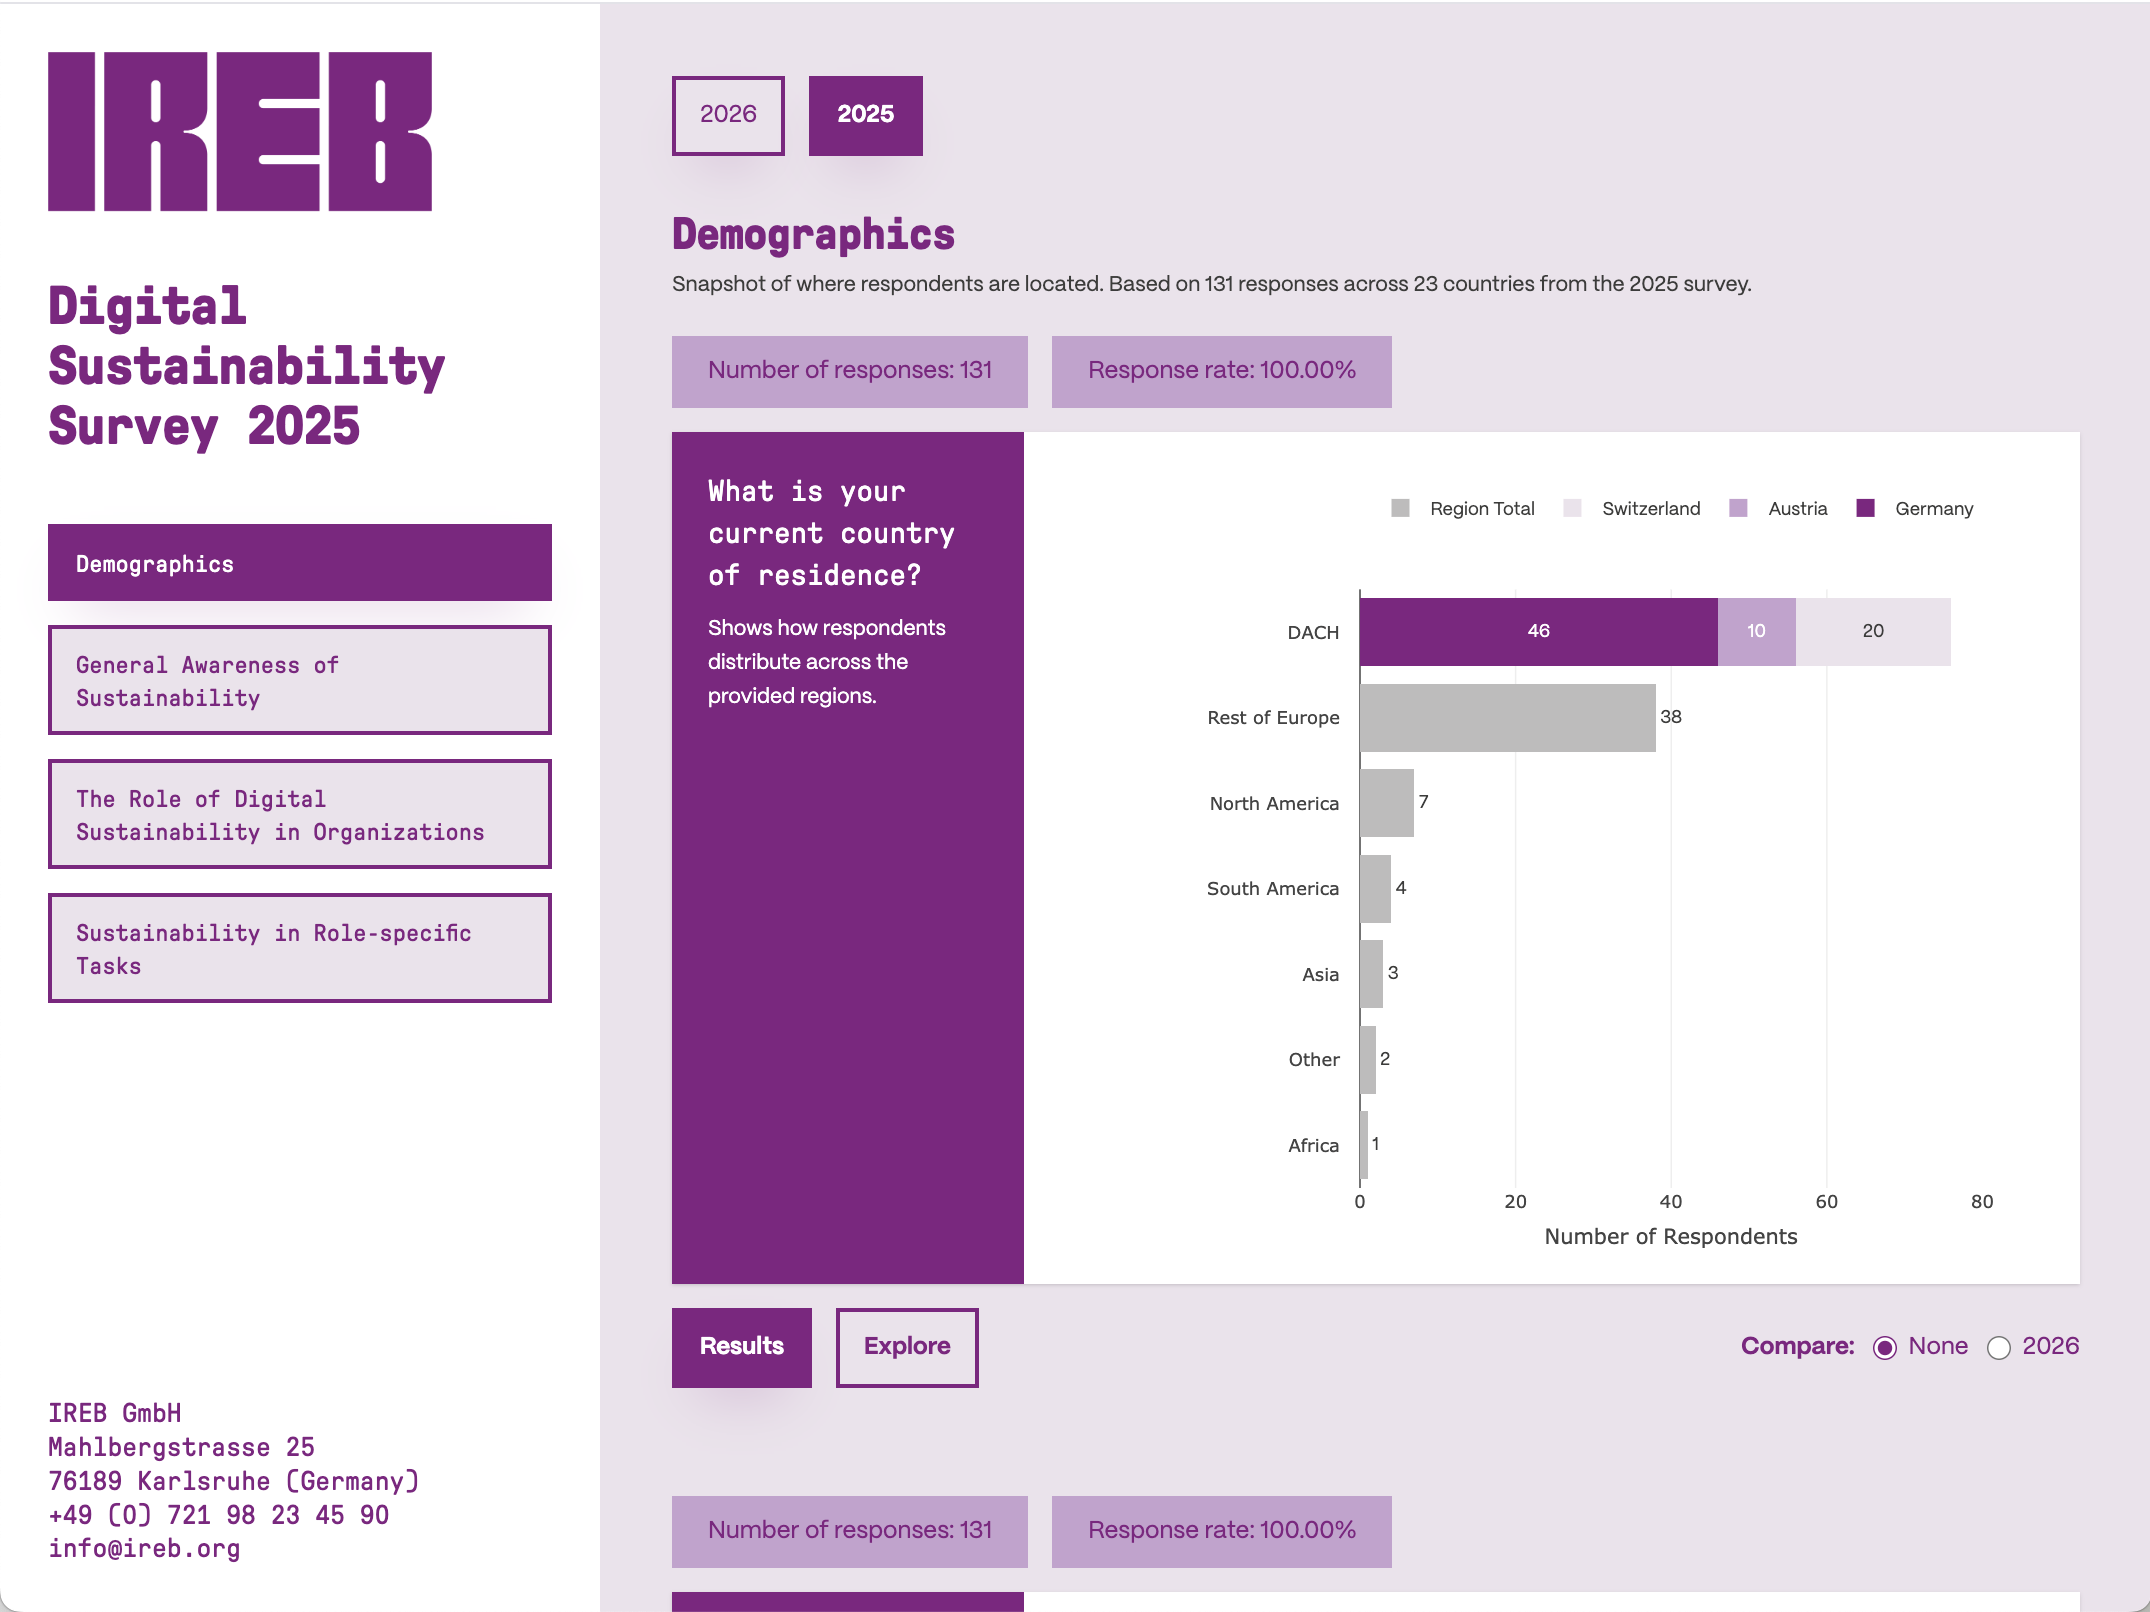
Dashboard Frontpage
Initial situation
Digital sustainability is a key topic in modern software engineering. While IREB collects valuable annual survey data, the previous Python-based dashboard lacked essential analysis features. It could not compare data over multiple years (longitudinal analysis), had inconsistent design, and required manual data maintenance.
Problem statement / Project goal
The primary goal was to develop a robust, interactive, and publicly accessible web dashboard. The focus was on enabling longitudinal analysis to visualize trends over time, automating the data pipeline for new survey results, and ensuring a high-quality user experience compliant with IREB's corporate identity.
Demographics Overview
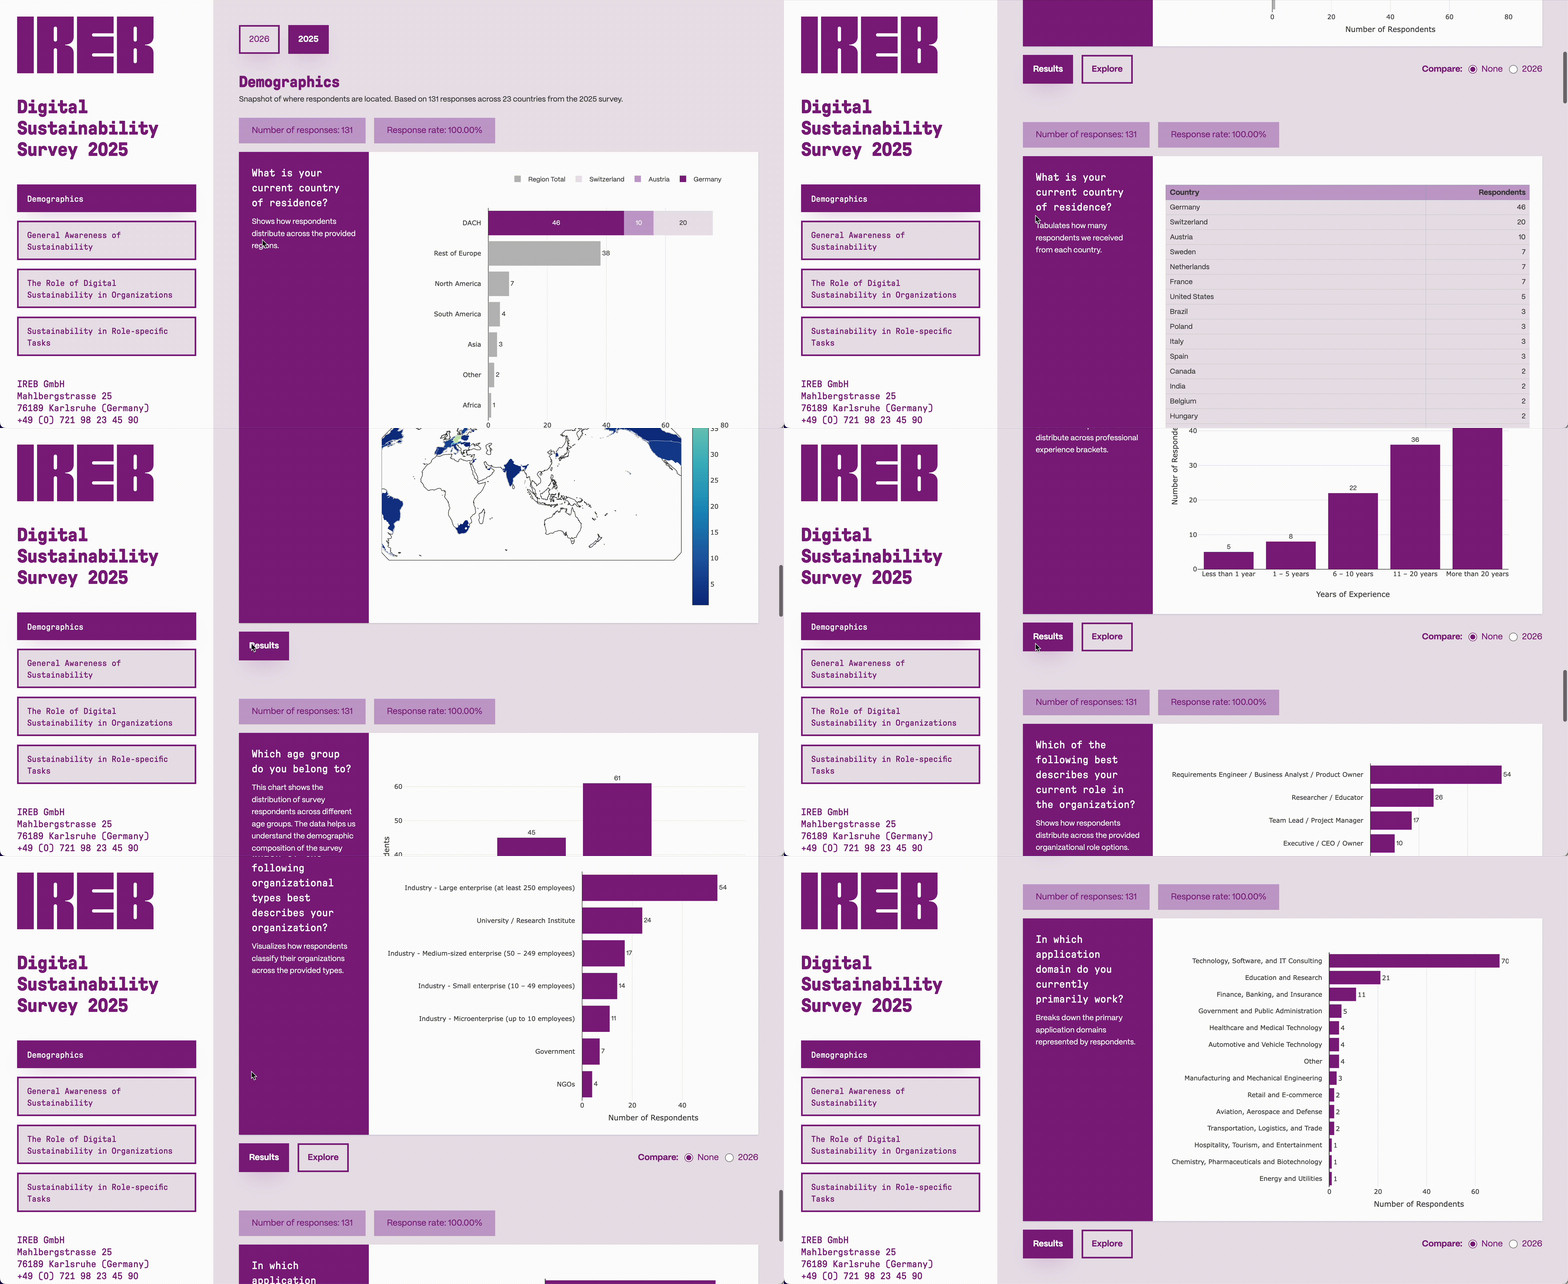
Immediate insight into the distribution of respondents by role, experience, and region to contextualize results.
Longitudinal Analysis
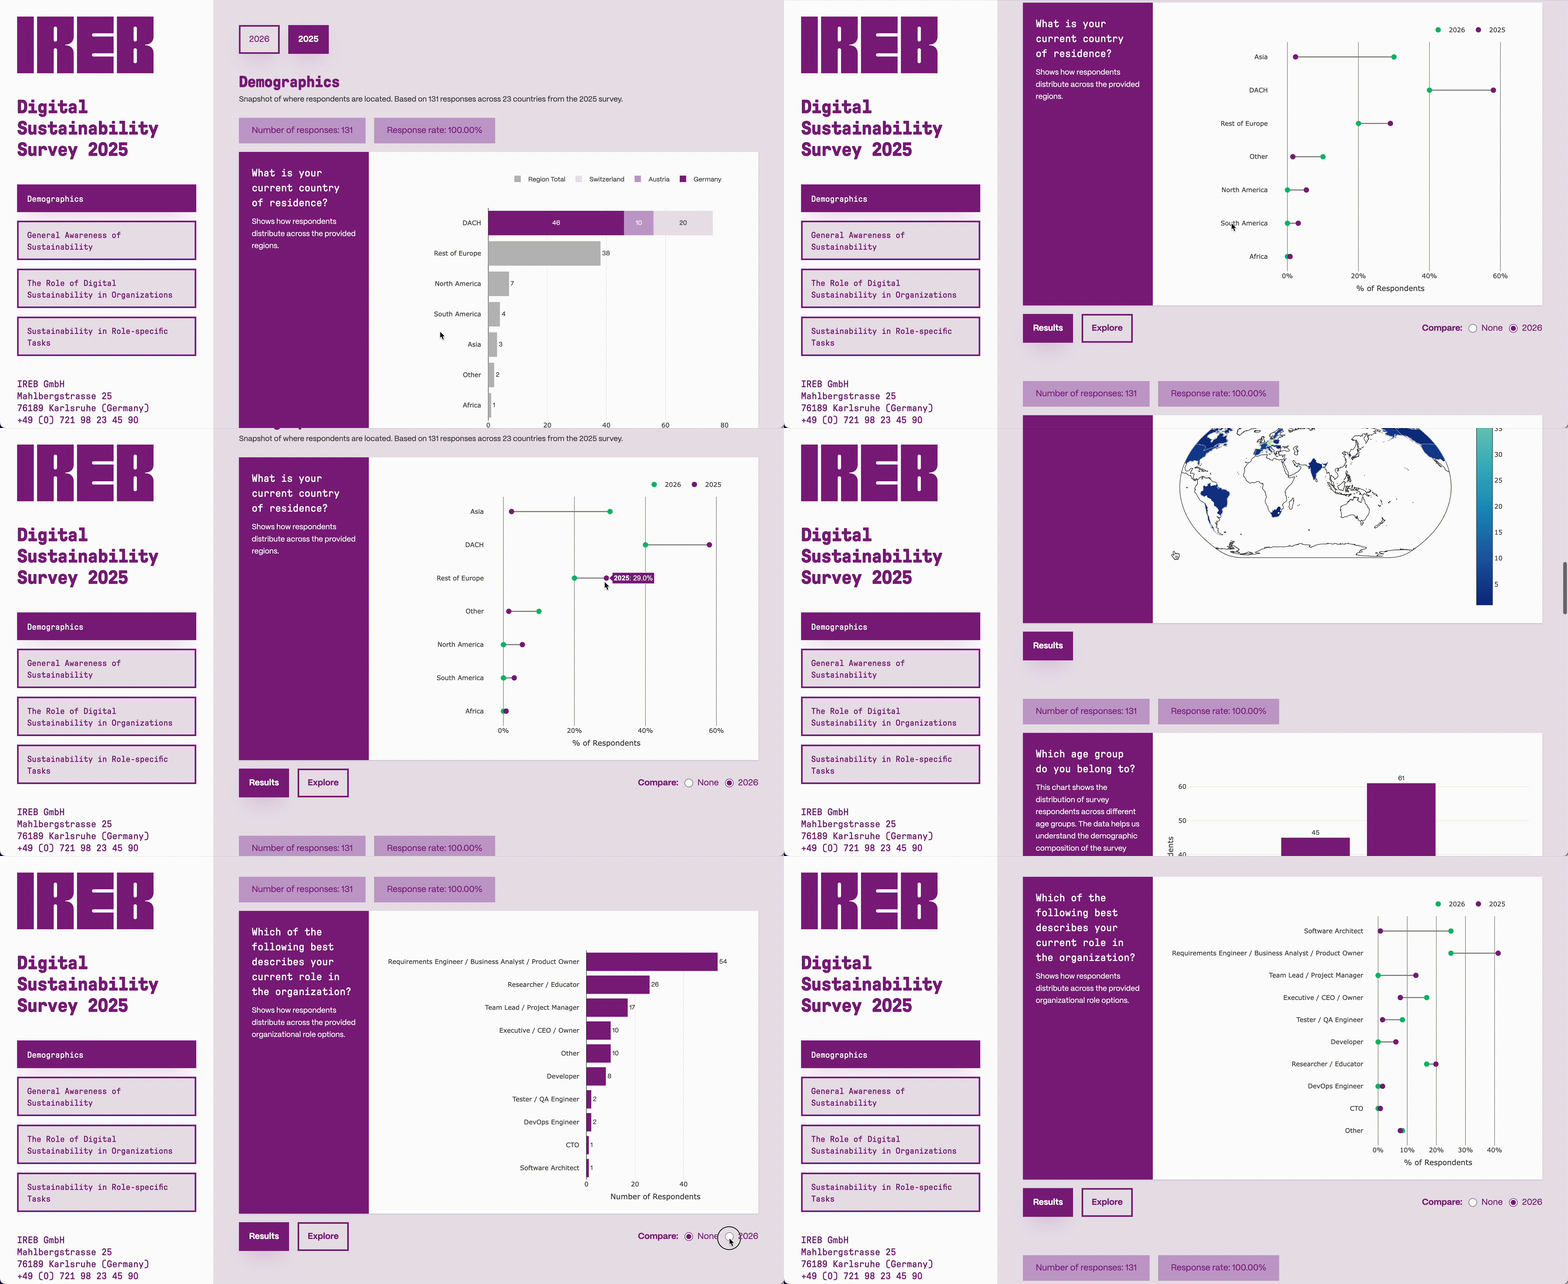
Comparison of data points across multiple years using specialized visualizations like dumbbell plots to highlight trends.
Explore Section
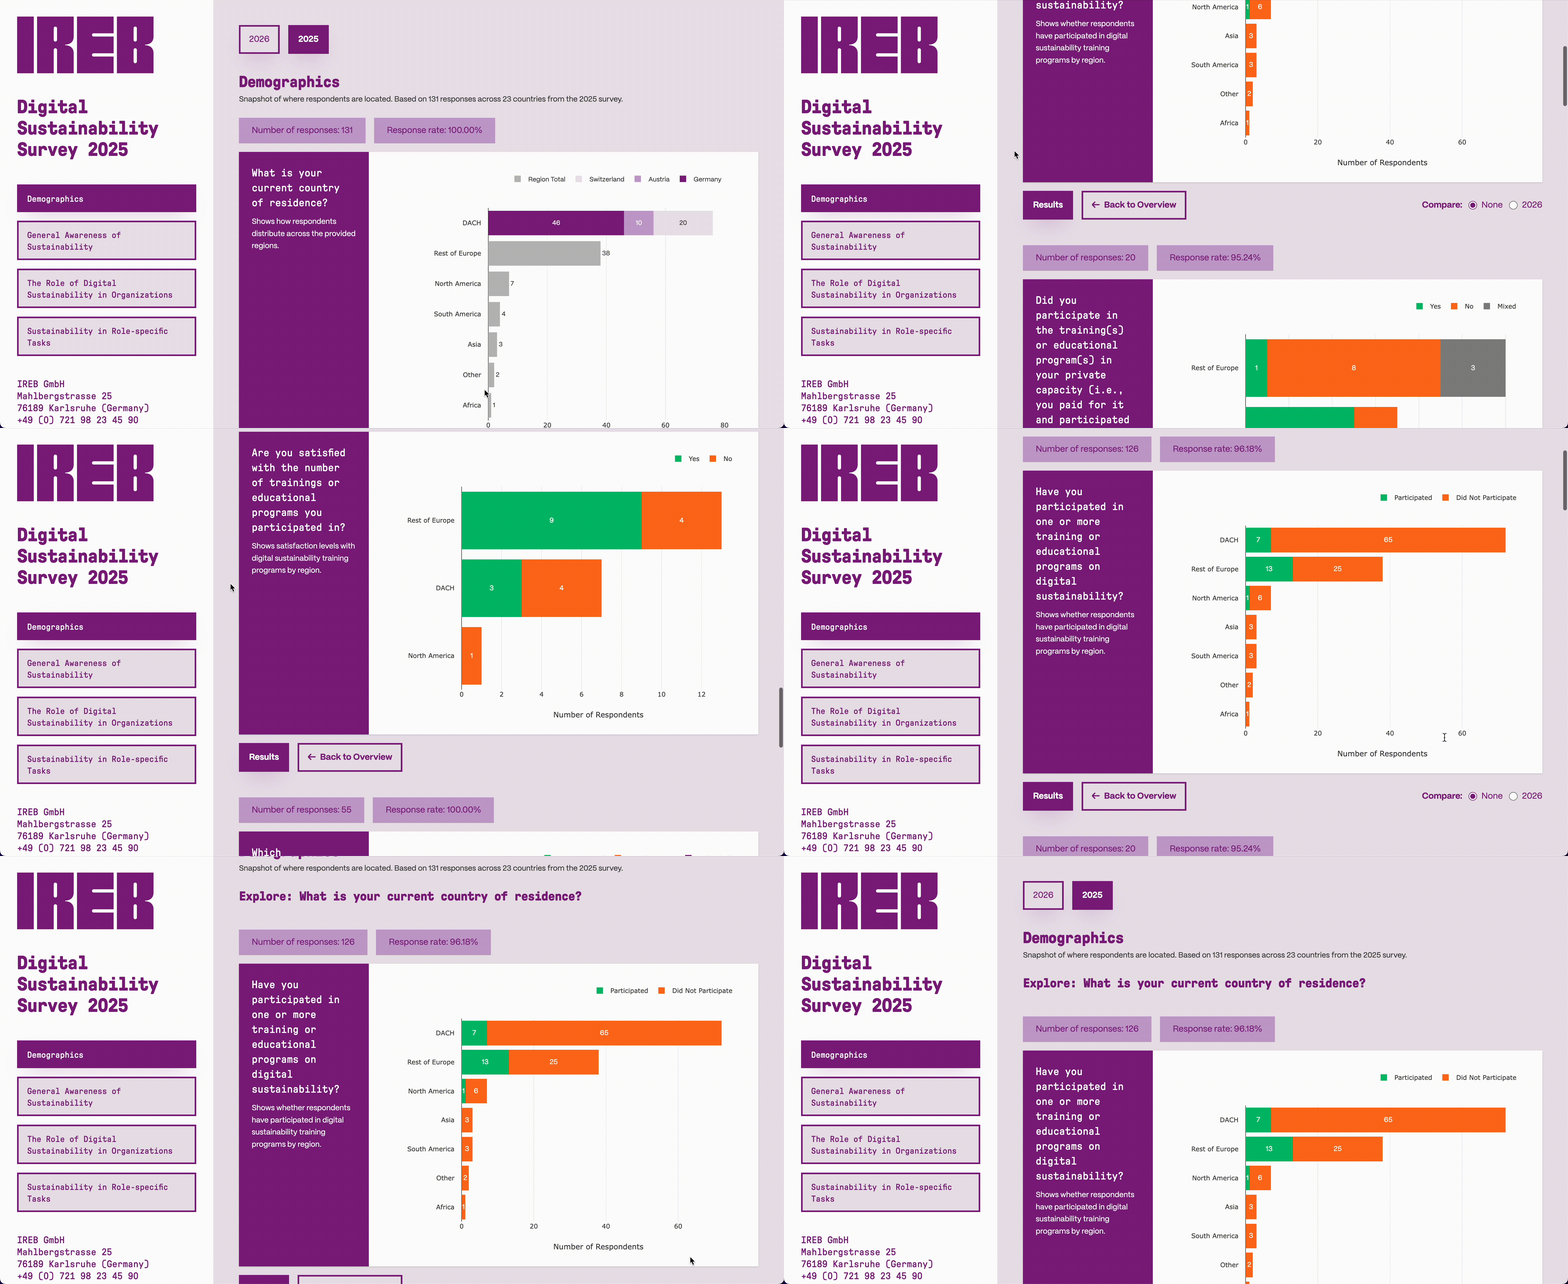
A dedicated area for cross-referencing different survey questions to discover complex correlations and dependencies.
Solution developed and its benefits
We implemented a modern Single-Page Application (SPA) using React and TypeScript. The solution utilizes a "Schema-on-Read" approach, processing raw CSV data client-side for maximum flexibility. The dashboard is hosted via Vercel with a fully automated CI/CD pipeline.
- Longitudinal Analysis: Visualizes trends and patterns over multiple years.
- Automated Data Pipeline: Automatically builds and deploys when new data is pushed to the repository.
- Interactive Visualizations: Uses Plotly.js for dynamic charts including heatmaps and grouped bars.
- Explore Mode: Enables deeper analysis by displaying a dedicated area of charts from multiple combined survey questions to reveal underlying patterns.
- Responsive Design: Fully accessible UI optimized for all devices using Tailwind CSS.
- Corporate Identity: Seamless integration with IREB's design system.
The resulting dashboard transforms static survey data into an engaging public resource. It allows researchers and the public to intuitively explore the evolution of digital sustainability practices in software engineering without manual overhead for the IREB team.
Testimonial
«Thank you Timon and Orkun! You have done an excellent job, the result is really worth showing to the public. This is looking very professional, and beyond just being worth presenting; it really is something both IREB and you yourself can be proud of. In the detailed view, I am excited about the different presentations, with stacked bar charts, heat maps, etc.»
IREB
Key terms
- Digital SustainabilityEcological, social, and technical dimensions of software systems
- Longitudinal AnalysisAnalyzing trends and patterns across multiple survey years
- React & TypeScriptModern frontend framework with static typing for robust development
- Plotly.jsLibrary for interactive, data-driven charts and complex visualizations
- Data VisualizationTransforming survey data into intuitive and accurate graphical representations
- Vercel CI/CDAutomated build and hosting pipeline ensuring continuous delivery
- User-Centered DesignAutomated build and hosting pipeline ensuring continuous delivery
- Automated ProcessingClient-side parsing and mapping of raw CSV data without manual intervention
IREB GmbH

IREB GmbH
Mahlbergstrasse 25
76189 Karlsruhe (Germany)
+49 (0) 721 98 23 45 90
info@ireb.org
ireb.org